
Bravo to the Trump Administration for achieving a 4.1% GDP growth rate in the second quarter (Q2) of 2018.
The last time that the United States reached 4% in a single quarter was in Q3 2014. Since the turn of the Century, the year 2000, out of a total of 74-quarters, only 11-quarters broke the 4% barrier. If President Trump can achieve his goal of sustained 4% GDP growth over the next decade, the U.S. economy will boom and American workers should be euphoric since this rate of GDP growth indicates that the President’s goal of creating 25 million new jobs is also achievable.
Achieving 4% GDP growth per year will not be easy. To achieve this level of growth, one would have to turn the clock back to the post-WWII decades in the 1950s and 1960s that achieved 4.2% and 4.5% GDP growth, respectively. The last time that the United States achieved 4% in ten consecutive years over the previous 5-decades was never (3.5% was the highest from 1976 to 1985). Notwithstanding, if the Trump Administration can tie the 3.5% record over the next decade, they will be worthy of much praise and his controversial policies largely vindicated.
Real GDP Quarterly Percent Change This Decade
Source: BEA, Table 1.1.1. Percent Change From Preceding Quarter
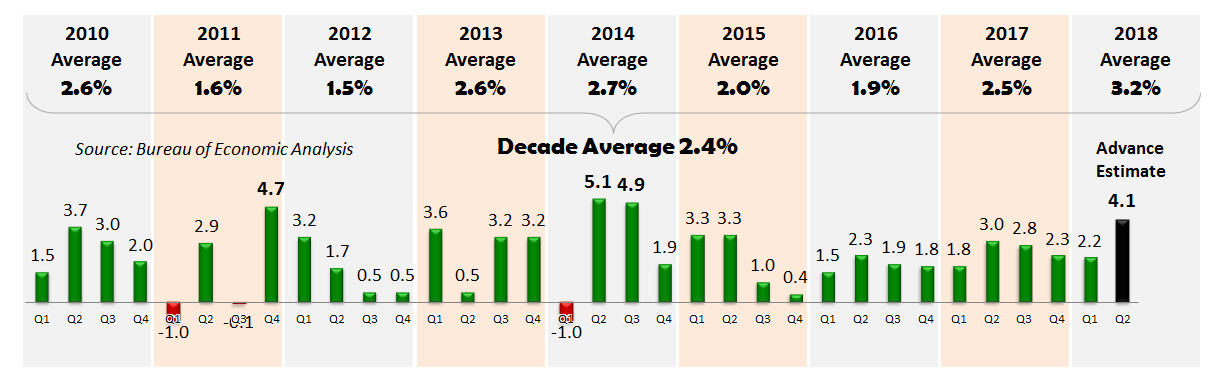
On 27 July 2018, the Bureau of Economic Analysis (BEA) released its “advance estimate” of 4.1% GDP growth for Q2 2018, which is based on preliminary data. BEA’s “second estimate” and “third estimate” are scheduled for release on 29 August and 27 September 2018. On 26 October, the BEA will release its advance estimate for Q3 2018.[1] The advance estimate is the statistic that garnishes the most attention and is generally a good predictor of future estimates.
Per BEA data[2], during the post-recession recovery period from Q1 2010 through Q2 2018, U.S. GDP averaged 2.4%. During the 32-quarters (8-years) of the Obama Administration, GDP averaged 1.9%. Subtracting the 4-quarters of the Great Recession year in 2009, the Obama Administration averaged 2.2% during the slow-growth economic recovery. During the first 6-quarters (Q1 2017 through Q2 2018), the Trump Administration averaged 2.7% GDP growth with a high-water mark of 4.1% today.
The Federal Reserve (U.S. central bank in charge of U.S. monetary policy) banks of Atlanta and New York use BEA GDP data to forecast GDP growth. The Federal Reserve Bank of Atlanta and Federal Reserve Bank of New York forecasting models are based on statistical filtering techniques that are common in big data analytics. Because these banks use different models, they can generate different forecasts of real GDP growth.
For Q2 2018, as of 26 July 2018, the Federal Reserve Bank of Atlanta’s GDPNow[3] model forecast was 3.8%, which was very close to the 4.1% BEA estimate released today. Unlike recent previous quarters that were downgraded significantly from initial projections, the Fed’s Q2 2018 projections hovered above the 4% level (at one point as high as 4.8%) since its initial forecast on 30 April 2018.
The Federal Reserve Bank of Atlanta’s “Blue Chip consensus” survey of leading business economists forecast that Q2 2018 growth would be 3.9% with a low estimate of 3.2% and a high estimate of 4.6%.
The Federal Reserve Bank of Atlanta’s GDPNow initial estimate for Q3 2018 will be released on 1 August 2018.
For Q2 2018, as of the week ending 20 July 2018, the Federal Reserve Bank of New York’s Nowcast[4] forecast was 2.69%—a less optimistic projection than the Federal Reserve Bank of Atlanta.
For Q3 2018, the Federal Reserve Bank of New York’s Nowcast initial prediction is a pessimistic 2.38%.
U.S. GDP History (1930 to Present)
Source: BEA, Table 1.1.1. Percent Change From Preceding Year
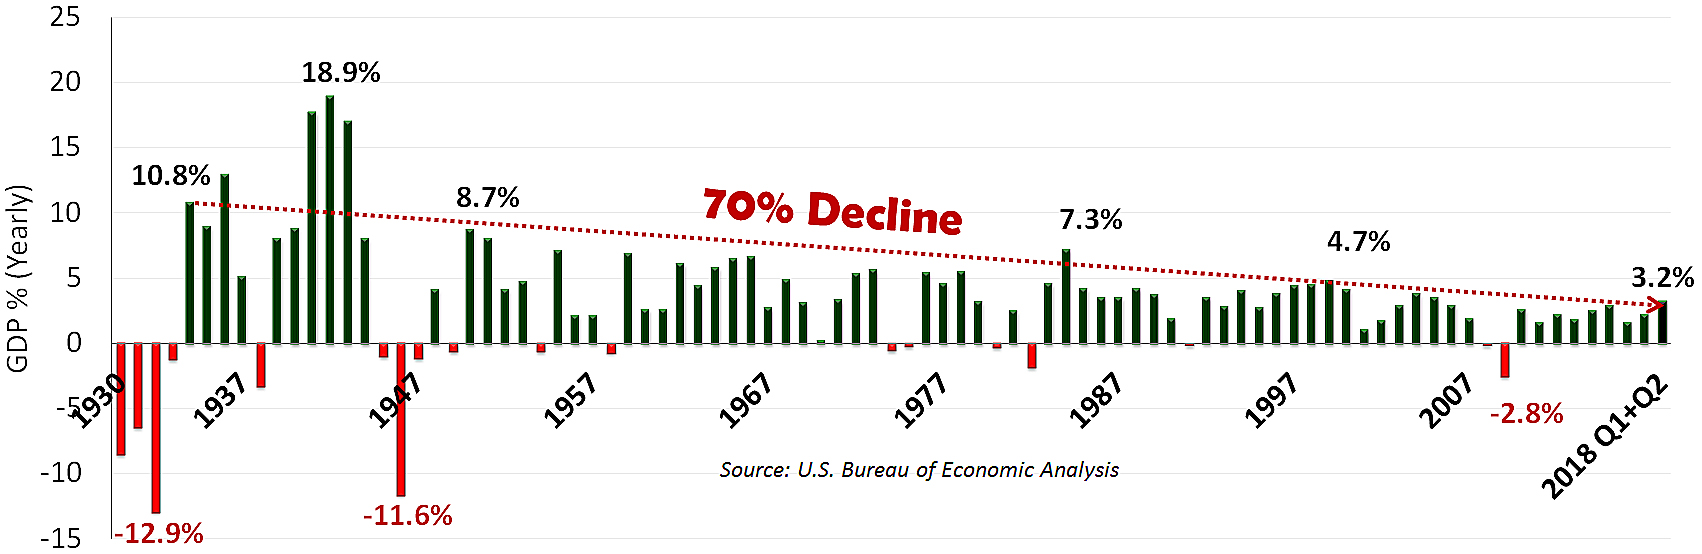
This chart, derived from BEA data, indicates that the U.S. GDP history from 1930 to present has been on a downward trend. Since the first positive GDP growth year after the end of the Great Depression, U.S. GDP growth declined 70% from 10.8% in 1934 to 3.2% today (average of the first two quarters in 2018). Hopefully, the BEA’s Q2 2018’s 4.1% estimate signals the beginning of an upward trend as opposed to a temporary anomaly. Barring an international or domestic crisis, which is certainly a possibility, President Trump’s aggressive economic restructuring (tax cuts and reform, reduced regulatory environment and balanced trade negotiations) will propel the American economy on a decidedly upward track.
Gross domestic product is one of the best ways to measure economic health. As stated by the BEA, “GDP is the value of the goods and services produced by the nation’s economy less the value of the goods and services used up in production. GDP is also equal to the sum of personal consumption expenditures, gross private domestic investment, net exports of goods and services, and government consumption expenditures and gross investment” as shown below.[5]
Personal Consumption/Expenditures as a Percent of U.S. GDP
Source: BEA, NIPA Tables, Table 1.1.5. Gross Domestic Product[6] 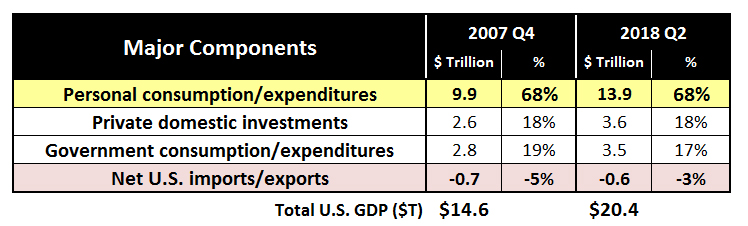
This table compares the four major components of U.S. GDP in Q4 2007 (the quarter prior to the Great Recession) to the most recent BEA estimate.
Personal consumption and expenditures (PCE) is overwhelmingly the primary component and driver of the U.S. economy. PCE is determined by how much of the income earned by households is being spent or purchased on goods and services. While PCE (highlighted in yellow) has grown from $9.9 to $13.9 trillion since 2007, it remains stable at 68% of GDP. PCE is also dependent on a growing labor force and the wages that the workforce earns. If labor and wages stop growing, then GDP stops growing. The opposite is also true.
As a rule of thumb, over the past decade, a 1% point uptick in GDP translated to about 1.5 million additional jobs per year. Today’s BEA advance estimate of 4.1% GDP growth is 1.9 percentage points higher than the average 2.2% growth over the last 33-previous quarters this decade. If this rule of thumb holds true and if a growth rate of 4.1% can be maintained, the Trump Administration should be able to double its current job creation rate of 193,000 jobs per month to 386,000 per month. This rate of job creation is high but achievable. In May 2010, the United States created 522,000 new jobs. In the first half year of 2018, the U.S. Bureau of Labor Statistics reports an average of 257,000 new jobs per month with a high of 324,000 new jobs produced in February 2018.[7]
As highlighted in red on the table above, Net U.S. imports/exports play a minor role (-3%) on overall GDP. However, it is the only component that is negative. If the Trump Administration could balance trade and make the Net U.S. imports/exports zero, approximately $600 billion could be added to the economy. $600 billion equates to 6 million jobs at $100,000 per job.
According to Secretary of Commerce Wilbur Ross, increasing gross domestic product growth by 1 percentage point will amount to $10 trillion more GDP in the next decade.[8] Per the International Monetary Fund, in the United States, for every 1% point increase in GDP, employment should increase by 0.6%.[9] So if Secretary Ross and the IMF are indeed correct, a $1 trillion yearly increase to our $20 trillion economy would be a 5% GDP increase that should generate a 3% increase in employment. Currently, U.S. employment stands at 150 million people. A 3% increase would, therefore, equate to an additional 4.5 million jobs per year. While this may all seem like fuzzy math, the point is that there is a direct correlation between GDP and job growth.
Concluding Remarks. According to a Bloomberg article entitled “Luck of the Draw”,[10] Bloomberg feels that any growth above 4% in Q2 2018 should be seen as temporary rather than a new reality. Per Bloomberg, the boost that the tax overhaul gave to inventories, consumer spending and business investment will likely fade in the future to 2.5% to 3.0% range, or lower if the U.S. domestic or international tensions worsen.
While Jobenomics agrees with this Bloomberg assessment, Jobenomics asserts that the Trump Administration deserves much more credit than the Bloomberg article endeavors to present. Breaching the 4% level is much than just “luck of the draw”. It is remarkable for this Administration that has been subject to continuous attacks from the media and the opposition party that are largely aimed at undermining the President and Administration’s policies. While GDP may recede to the 2.5% to 3.0% range in the next several fiscal quarters, this business-friendly President has rallied the U.S. business base and provided new hope for countless American workers. More importantly, the Administration instituted structural changes necessary to support the President’s goal of sustained 4% GDP and 25 million new jobs, which the bi-partisan Jobenomics National Grassroots Movement supports.
Download free PDF of this article at https://jobenomics.com/wp-content/uploads/2018/07/4-GDP-Growth-27-July-2018.pdf.
About Jobenomics: Jobenomics deals with the economics of business and job creation. The non-partisan Jobenomics National Grassroots Movement’s goal is to facilitate an environment that will create 20 million net new middle-class U.S. jobs within a decade. The Movement has an estimated audience of 30 million people. The Jobenomics website contains numerous books and material on how to mass-produce small business and jobs as well as valuable content on economic and industry trends. For more information see https://jobenomics.com/.
[1] BEA, 2018 News Release Schedule, https://www.bea.gov/newsreleases/news_release_schedule.htm
[2] BEA, National Data, GDP, Table 1.1.1. Percent Change From Preceding Period in Real Gross Domestic Product, https://www.bea.gov/iTable/iTable.cfm?reqid=19&step=2#reqid=19&step=3&isuri=1&1921=survey&1903=1
[3] Federal Reserve Bank of Atlanta, GDPNow, https://www.frbatlanta.org/cqer/research/gdpnow.aspx
[4] Federal Reserve Bank of New York, Nowcasting Report,
https://www.newyorkfed.org/research/policy/nowcast.html.
[5] U.S. Bureau of Economic Analysis, https://bea.gov/newsreleases/national/gdp/gdpnewsrelease.htm
[6] U.S. Bureau of Economic Analysis, NIPA, Tables, Table 1.1.5, Gross Domestic Product, retrieved 20 April 2018, https://www.bea.gov/iTable/iTable.cfm?reqid=19&step=2#reqid=19&step=3&isuri=1&1921=survey&1903=5
[7] U.S. Bureau of Labor Statistics, Employment, CES0000000001, https://data.bls.gov/timeseries/CES0000000001?output_view=net_1mth
[8] CNBC, Tax reform will boost the US economy by a full percentage point, says Wilbur Ross, 26 September 2017, https://www.cnbc.com/2017/09/26/tax-reform-wilbur-ross-sees-1-percent-gdp-jump.html
[9] IMF, The Evidence that Growth Creates Jobs: A New Look at an Old Relationship, https://blogs.imf.org/2016/11/09/the-evidence-that-growth-creates-jobs-a-new-look-at-an-old-relationship/
[10] Bloomberg, Markets, U.S. 4% GDP Growth Seen More ‘Luck of the Draw’ Than New Reality, 23 July 2018, https://www.bloomberg.com/news/articles/2018-07-23/u-s-4-gdp-growth-seen-more-luck-of-the-draw-than-new-reality

