
COVID 2021
Part III, Government Stimuli
By: Chuck Vollmer, Jobenomics Founder & President
16 February 2021
Executive Summary
Most Americans are ready to put the pandemic in their rearview mirror. Unfortunately, the coronavirus is likely to be as destructive in 2021 as in 2020. COVID-related deaths will not magically disappear with the advent of new vaccines. Unemployment rates and small business closures are likely to increase due to the extended economic slowdown that may not end in 2021.
Jobenomics concurs that the U.S. government needs to “go big” to stimulate the economy and provide a safety net for suffering citizens. While Jobenomics supports going big, stimulus programs need to more strategic and less short-term focused. The government allocated trillions of dollars to businesses that are not likely to survive the pandemic or thrive in the new normal. The Fed and Congress earmarked $1.7 trillion for struggling and small businesses. These policymakers should also consider an equivalent amount of money ($4.3 trillion remains uncommitted) to mass-produce locally owned and operated startup businesses in under-resourced communities. It is also of great concern that the U.S. government failed to include a line-item for creating a new federal organization dedicated to preparing for the next natural or human-engineered biological event that is sure to come. This new organization should be of the size and scope of the new U.S. Space Force or the U.S. Cyber Command.
Part I of this COVID 2021 series presented five possible scenarios from fanciful to worst case. The likely scenario postulated that COVID 2021 would claim as many Americans as COVID 2020.
Part II addressed U.S. workforce impact due to coronavirus quarantines, lockdowns, and closures. Jobenomics forecasts that non-employed work-capable adults will soon exceed the number of private-sector workers.
Part III, this posting, examines the impact of $10.5 trillion worth of current and President Biden’s proposed $1.9 trillion new government stimulus packages and provides updates to the earlier postings.
Part IV, coming in March 2021, discusses the need to reallocate a portion of the remaining federal stimulus funds to mass-produce startup businesses that can flourish in the new normal.
Parts V & VI will focus on COVID 2021 impact on the U.S. economy (GDP) and stock markets.
Part VII will be a comprehensive mid-year update.
PART I: COVID 2021, Scenarios (originally posted 3 January 2021)
Part I Update
The COVID Grim Reaper claimed the lives of 336,802 Americans in 2020.[1] To allow people to make a sober evaluation of the new normal and plan their lives accordingly, Jobenomics posted five different COVID 2021 scenarios ranging from fanciful to a worst-case on 3 January 2021.
U.S. COVID-19 confirmed deaths increased from 2,516 daily deaths (7-day rolling average) from 1 January to only 3,031 deaths per day on 15 February 2021—a 26% increase.[2] Experts predicted that the daily death rate would peak at 4,000 (a potential 59% increase) by mid-February. [3]
Other promising trends include decreases in cases and hospitalizations. New infections decreased from 250,000 to 110,000 over the last month. Hospitalizations also dropped from a peak of 130,000 COVID patients to 65,000 over the same period, giving weary healthcare providers a glimmer of hope that the worst may now be in the rearview mirror. However, we have a long way to go since new cases, and hospitalizations amounted to only 35,000 and 30,000 patients at the beginning of this current third wave in September 2020.[4]
As evidenced by Isreal, where 75% of the over-60 population (their most vulnerable citizens) has received the prescribed double doses of the vaccines, hospitalizations are down significantly. Thus, the vaccines are working, and the U.S. worst calamity may not happen as long as the new variants (B.1.1.7 United Kingdom, B.1.351 South Africa, and P.1 Brazil) do not cause the fourth wave of infections in 2021.
Jobenomics COVID 2021 Scenarios
Daily New Confirmed Deaths, 7-Day Rolling Average
Source: Our World In Data, Oxford
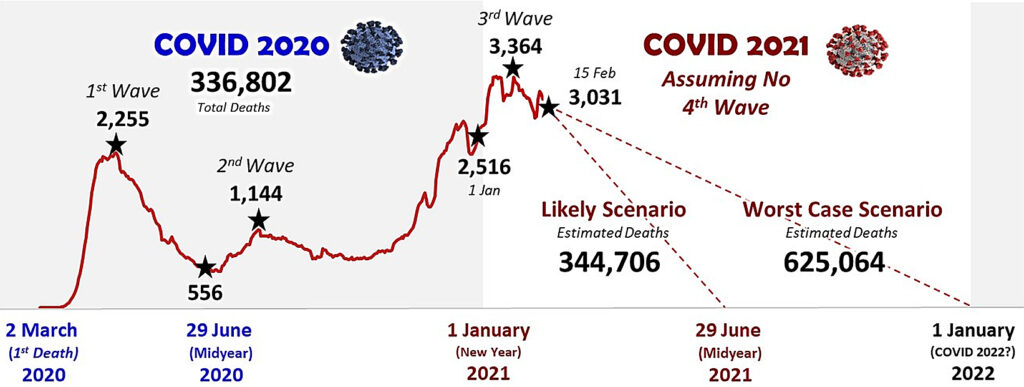
Most Americans believe that miracle vaccines will eradicate or achieve herd immunity by midyear 2021. If one assumes a constant downward trend from today’s 3,031 daily deaths to 0-deaths by 29 June, the COVID 2021 Grim Reaper will claim 344,706 Americans, 2% higher than the 336,802 lives lost in 2020. If the vaccines do not work as advertised or new COVID-19 variants reduce effectiveness, up to 625,064 Americans could die from this coronavirus by year’s end, 86% higher than 2020.
As of 10 February 2021, only 3.7% of all adult Americans, or 9,840,429 of a total adult population of 267,668,677, received the recommended two doses of vaccines.[5]
Currently, the U.S. vaccination rate is 1.5 million per day. According to the Bloomberg Vaccine Tracker, “at this rate, it will take an estimated nine months (i.e., November 2021) to cover 75% of the (U.S. adult) population with a two-dose vaccine.” Unless the United States substantially increases its vaccination rate, the U.S. death rate could be closer to Jobenomics’ potential worst-case number (without the fourth wave) of nearly 625,064 fatalities.
While horrid, 625,064 deaths equate to only 0.2% of the U.S. population and are roughly equivalent to annual heart disease (647,457) and cancer (599,108) U.S. fatalities. Comparatively, the Black Death killed 33% of people in 14th Century Europe. During the 1918 Spanish flu, the United States lost 7-times the number of citizens (0.7% or 675,000 out of a population of 103 million). Despite the severity of these pandemics and chronic diseases, humans find a way to survive and rebuild shattered lives and livelihoods.
Unlike wartime losses that claim prime-age workers, 92% of all American lives harvested by COVID 2020 Grim Reaper were over 55 years old. If we can get our prime-age workers back on the job during COVID 2021, economic growth should quickly resume. However, returning people to work is problematic if the American COVID death rate continues to climb and businesses shuttered.
PART II: COVID 2021, Workforce Impact (16 January 2021)
Part II Update
Private Sector Employment Gains & Losses
1 February 2020 to 1 February 2021
Source: U.S. Bureau of Labor Statistics

Since June 2020, U.S. job creation has been a steady-state stall losing altitude from a job creation peak of 4,807,000 to a measly 6,000 new positions in January 2021. Jobenomics predicts that this downward trend will continue throughout 2021. The collateral damage done by the pandemic will last many months (or years) after the COVID-19 Grim Reaper is pronounced dead.
Working versus Non-Working Populations
1 February 2000 to 1 February 2021
Source: U.S. Bureau of Labor Statistics
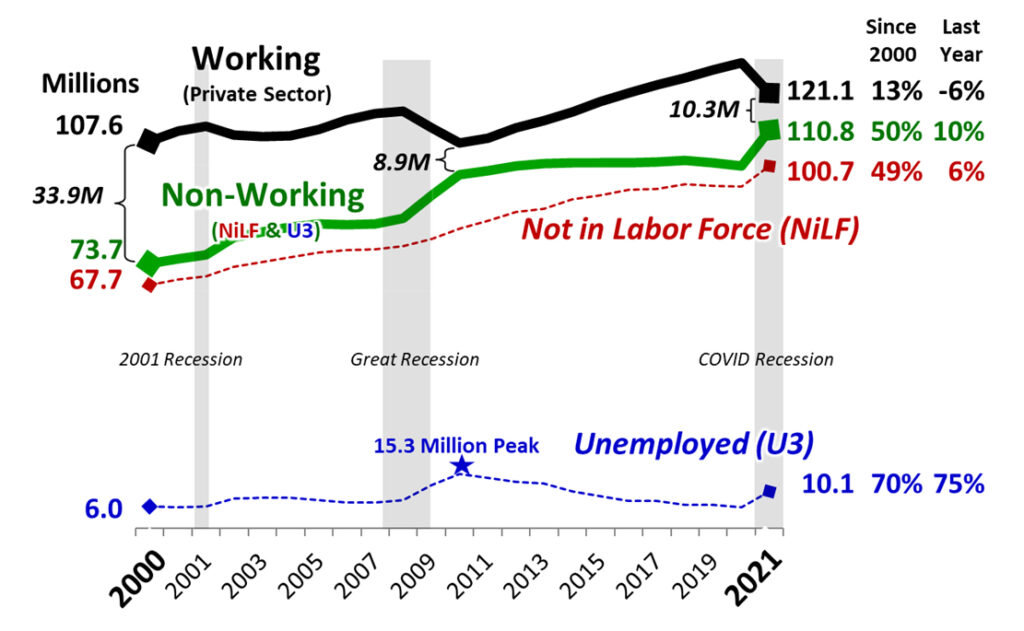
In the year 2000, the gap between workers and non-workers was 33.9 million people or 1.5 workers for every work-capable adult. This gap shrunk to 8.9 million at the end of the Great Recession and subsequently widened during the Obama and Trump Administrations. Then the pandemic hit. Since the beginning of the coronavirus in February 2020, the number of employed workers dropped by 6%, and the non-working cadre increased by 10%, closing the gap to only 10.3 million, or 1.1 workers per every work-capable person, as of 1 February 2021. Considering the high rate of small business closures and the number of furloughed workers (currently counted as employed) becoming officially unemployed, the likelihood of sidelined non-working adults outnumbering the private-sector wage or salary workers is foreseeable by year’s end.
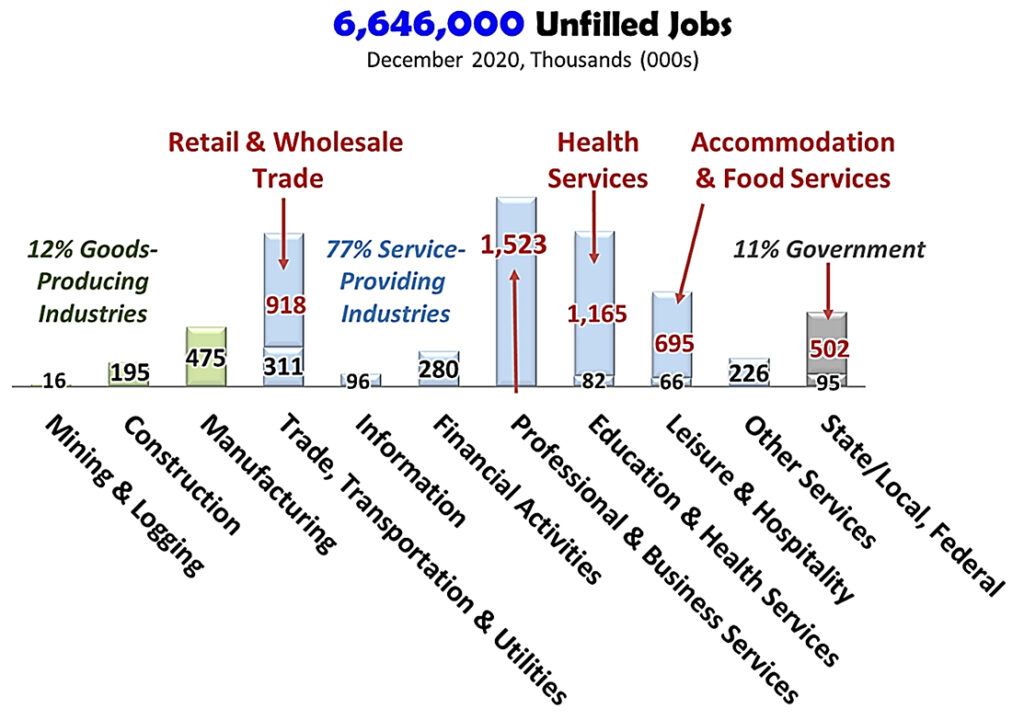
The most shocking trend involves the Not-in-Labor-Force cadre (adults that can work but are no longer looking for jobs) that grew from 67.7 million in 2000 to 100.7 million today, a growth of 49%. Even more astonishing is that 93% of the people in this cadre “do not currently want a job,” according to BLS survey data.[6] Equally troubling is that the remaining 7% or 6,957,000 sidelined workers cannot find work with 6,646,000 open jobs, as shown.
Job Openings By Industry
Source: U.S. Bureau of Labor Statistics[7]
As will be addressed in the next section, the U.S. federal government is in the process of spending more stimuli ($13 trillion) for the pandemic than the 18-month Great Recession of 2007-2009 ($12 trillion). While most of this spending is necessary, a significant percentage is politically rather pandemic-oriented.
As this pandemic rolls on and the government incentivizes workers to stay home, workfare apathy is growing. Workfare apathy and welfare addiction go hand-in-hand. The more people lose the desire to look for work, the more they become nomads relying on temporary task-oriented jobs, government/familial assistance, and the underground economy to survive.
PART III: COVID 2021, Government Stimuli
The U.S. labor force now has 8.3 million fewer workers than when the pandemic began. COVID 2020 ended with a loss of 204,000 private-sector jobs in December, and COVID 2021 started the new year in January with a pathetic gain of only 6,000 jobs.
In a speech to the Economic Club of New York on 10 February 2021, Federal Reserve Chair Jerome Powell warned the American public that the U.S. job market remains a long way from recovery.[8] According to Chairman Powell, the “only way” to deliver full employment is by a “society-wide commitment,” a provocative statement given the plethora of ideological, political, and economic divides that embroil our nation. Notwithstanding, Powell is correct about the urgency needed to restore our workforce and the need for synergic monetary and fiscal policies during financial crises like the Great Recession and this COVID crisis.
Monetary policy is the macroeconomic policy laid down by the Federal Reserve System (U.S. central bank or the Fed) that manages the money supply and interest rates. Fiscal policy is how a government (U.S. Congress) adjusts federal government spending levels and tax rates.
Government Stimuli During & After The Great Recession Of 2007-2009
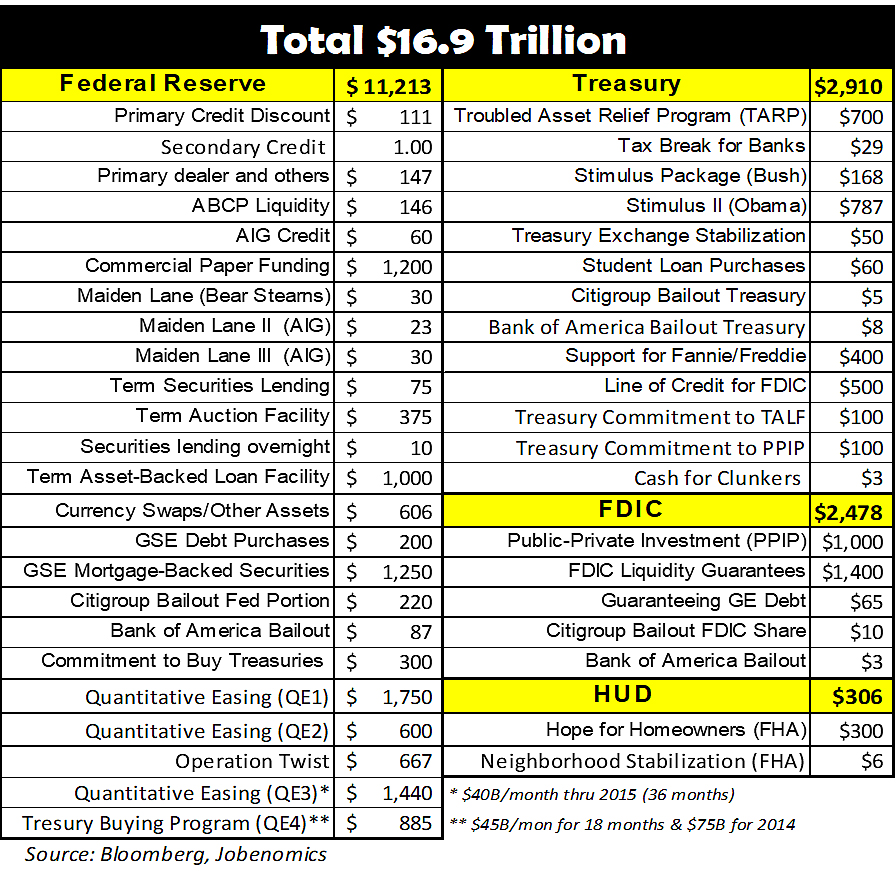
Jobenomics created and modified the above chart during and after the 2007-2009 Great Recession, resulting in the loss of 8,794,000 private-sector jobs during the 26-months from December 2007 to February 2010. The combined Federal Reserve monetary and Legislative (Congressional) fiscal response to these massive job losses during the Great Recession amounted to $16.9 trillion, of which $11.2 trillion was from the Fed. The remaining $5.7 trillion came from the U.S. Treasury, U.S. Department of Housing and Urban Development (HUD), and Federal Deposit Insurance Corporation (FDIC).
Comparably, the pandemic claimed 18,008,000 jobs during its first four months (February-May 2020). Over the next eight months, the United States clawed back about half of these losses, resulting in a net loss of 8,565,000 private-sector jobs over the 12-months from February 2020 through January 2021.
COVID Money Tracker
$Trillions as of 3 February 2021
Source: Committee for a Responsible Federal Budget[9]
![]()
According to an analysis by the Committee for a Responsible Federal Budget, the U.S. government’s combined fiscal response to mitigate pandemic economic and workforce damage is $10.5 trillion, of which $5.7 trillion is from the Fed, $4.1 trillion from Congressional actions, and $0.7 trillion from the White House.
Unlike Great Recession funding spent over several years, the U.S. government frontloaded $6.2 trillion in 2020 to mitigate collateral damage caused by the 18 million job losses in the first four months of the pandemic.
Federal Reserve System COVID 2020 Relief Programs.
Of the $5.7 trillion allowed by the Fed, $2.6T was for asset purchases (long-term Treasury bonds and mortgage-backed securities), $2.1T for liquidity measures (mainly Repo operations for short-term borrowing for dealers in government securities), and $0.9T for loan programs (mainly Paycheck Protection Program Liquidity Facility to finance SBA loans to small businesses to keep workers on the payroll even if these firms are temporarily closed due to COVID-19).
While there is no assigned dollar value, the Fed also cut baseline interest rates down to near zero percent and eliminated reserve requirements for all U.S. banks to increase lending and stimulate the economy.
While the Fed does not print money, it controls the money supply by allowing the U.S. Treasury to print as much money needed to stimulate the economy. It can also increase the money supply via an asset program called quantitative easing (QE).
In QE, the Fed purchases trillions of dollars worth of financial securities (mostly government bonds) from financial institutions that lend this newly-supplied cash to businesses and individuals. The Fed records all of these transactions on its balance sheet.
Like any balance sheet, the Fed’s balance sheet consists of assets and liabilities. The money that the Fed infuses into the economy shows up as an asset. Approximately 60% of the Fed’s current $7.4 trillion asset portfolio includes various U.S. treasuries (notes, bills, and bonds).
The remainder mainly consists of mortgage-backed securities (bundled home loans traded on the stock market) and loans extended to member banks via repurchase agreements (Repo) and discount window (lending facility to help commercial banks with short-term needs).
According to the Board of Governors of the Federal Reserve System, during the 2007-2009 financial crisis and subsequent recession, the Fed’s balance sheet “increased significantly from $870 billion in August 2007 to $4.5 trillion in early 2015.”
Total Assets Of The Federal Reserve
Source: Board of Governors of the Federal Reserve System[10]

As shown, the influx of $1.3 trillion into the U.S. economy by the Fed during the Great Recession from 18 August to 22 December 2008 (4 months) was considered “going big” by historical standards.
During COVID 2020, from 24 February to 8 June 2020 (3½ months), the Fed balance sheet soared $3.3 trillion ($4.2 trillion to $7.2 trillion), which dwarfed the $1.3T “going big” in 2008.
Congressional & White House COVID 2020/2021 Relief Programs.
Congressional & White House COVID 2020 Stimulus Recipients
$ Billions as of 3 February 2021
Source: Committee for a Responsible Federal Budget[11]
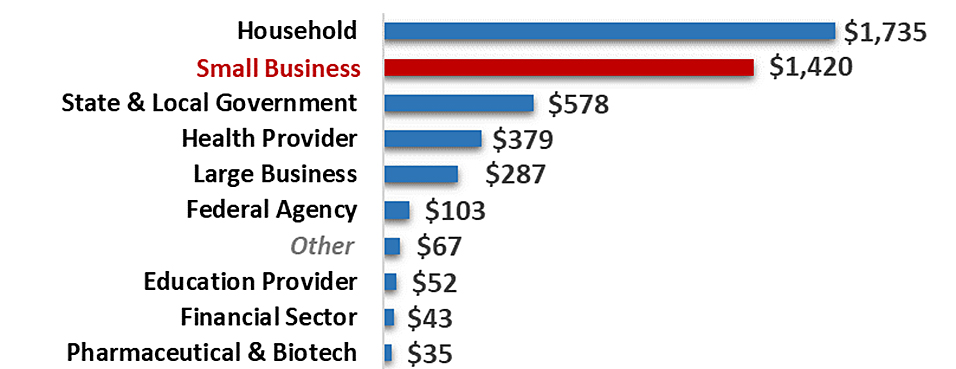
Congressional legislation to combat the pandemic amounted to $4.1 trillion in 2020. Legislative actions included the following seven major programs:
- Coronavirus Aid, Relief, and Economic Security (CARES) Act (various spending, loan, tax break, and other programs for individuals, households, businesses, healthcare institutions, and states), $2.2 trillion
- Response & Relief Act (various loan, direct payments, income support, health, State & Local, tax policy, and other programs), $966 billion
- Paycheck Protection Program (PPP) and Health Care Enhancement Act Response & Relief Act (additional funding to replenish and supplement programs under the CARES Act, including PPP, small business disaster loans and grants, hospitals and health care providers, and testing), $627 billion
- Families First Coronavirus Response Act (required certain employers to provide employees with paid sick leave or expanded family and medical leave for specified reasons related to COVID-19), $212 billion, expired 31 December 2020
- September 2020 Continuing Resolution (a bipartisan continuing resolution to extend federal government funding and avoid a shutdown), $32 billion
- Coronavirus Preparedness and Response Supplemental Appropriations Act (health spending, loan, and foreign affairs programs), $6.9 billion
- Emergency Aid for Returning Americans Act (temporary assistance for U.S. citizens and their dependents who are returning from foreign countries), $9 million
White House programs to combat the pandemic amounted to $603 billion in 2020 by the Trump Administration and $55 billion by the Biden Administration in 2021. White House programs collectively included the following:
- Short term relief to taxpayers, $401 billion
- Income support for student loans and home foreclosures, $145 billion
- Healthcare provider assistance, $100 billion
- Disaster relief and unemployment funds, $8 billion, and activation of the National Guard for COVID-19 response operations
- Other (Defense Production Act for critical medical resources, food banks, immigration bans), $4 billion
President Biden’s $1.9 Trillion “American Rescue Plan”
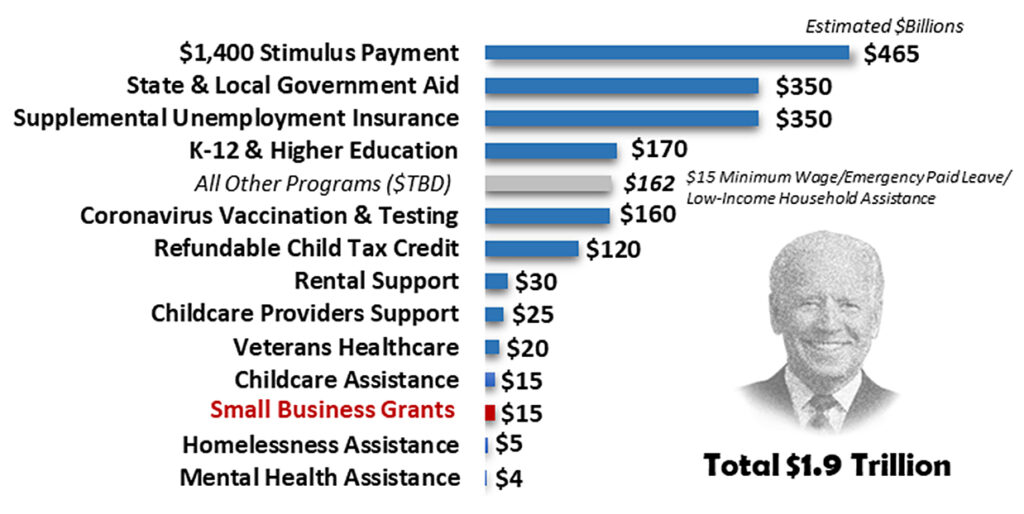
President Biden’s $1.9 Trillion “American Rescue Plan” is currently being addressed by the U.S. Congress. Except for a few non-COVID-related items (e.g., minimum wage and state and local government aid), Jobenomics anticipates that the U.S. Congress will enact the President’s plan in March 2020 on a bipartisan basis.
The Jobenomics perspective on the level and types of federal spending shown above is generally favorable. While Jobenomics disagrees with using these funds to curry political favor, we understand that a new Administration needs to make its mark during the Presidents’ first 100-days in office.
People and businesses are suffering and need help now. On the other hand, these programs need to more strategic and less short-term focused. For example, the federal government allocated trillions of dollars to businesses that are not likely to survive the pandemic or thrive in the new normal. This money would be better spent on startup businesses, like e-commerce and on-demand firms, that are flourishing and will continue to grow via the digital economy that the pandemic has advanced a decade ahead of economic predictions. Working at home or telecommuting from home is now an established practice.
San Francisco’s largest private-sector employer, Salesforce, and the anchor tenant of iconic Salesforce Tower, the second-tallest skyscraper west of the Mississippi, announced a permanent “work from anywhere policy” following the pandemic. Stay-at-home, lockdowns, and quarantine orders were the driving forces of this policy change.
Workforce implications of service-providing companies abandoning the commercial buildings and urban centers are profound. Not only are downtown areas in San Francisco and New York City like ghost towns, but they also may never recover due to the telecommuting impact on the indirect workforce. Indirect labor is the labor of those not directly involved in producing goods and services. A direct worker’s wage or salary in the service-providing supersector (100 million workers, or 83% of all employed Americans) supports two or three indirect workers in support industries (e.g., food, entertainment, hospitality, and other services businesses).
According to the San Francisco Business Times, Salesforce is the city’s largest employer with 9,450 employees.[12] Since Salesforce employees are generally highly paid, their indirect workforce impact is close to 30,000 indirect jobs (1 direct = 3 indirect). If a sizable number of Salesforce employees chose to telecommute, the impact on indirect workforce-related businesses would be severe. If the next four largest San Francisco companies (Wells Fargo, United Airlines, Sutter Health, and Uber Technologies with 25,000 direct employees) followed Salesforce’s lead, up to 75,000 indirect jobs could be at risk.
The post-pandemic recovery period will be challenging for small firms that survived the pandemic. The loss of tens of thousands of highly-paid customers would cause many small businesses to close. Small business vitality is essential to other key industries like tourism and hospitality. Many tourists would travel to San Francisco and New York City if the night-life were dead and vagrants occupied shuttered businesses?
Some people would say that urban losses are suburbia’s gain. This belief is not necessarily true. In the new normal, telecommuters who work at home tend to eat at home and spend their discretionary income on home improvement and home entertainment systems. Social distancing and mask-wearing restrictions won’t be lifted in 2021 and may extend well into 2022.
In addition to telecommuting, the pandemic accelerated the so-called retail apocalypse due to the dramatic shift from in-store to online shopping. Suburban strip malls, potential recipients of the downtown urban exodus, are barely surviving since most small retail businesses cannot mount an effective e-commerce strategy like the big box stores or e-retailers like Amazon. Pop-up stores and click-and-collect schemes are unlikely to help save the mom-and-pop store operator.
So, what the answer to the decaying small business sector that employs 59,206,000 American workers, or 49% of the entire U.S. private sector workforce?[13] Simply stated, the solution to mitigating small businesses’ death rate is to increase birthrates by mass-producing startups.
Over the last decade, the Jobenomics Grassroots Movement has grown exponentially, with chapters across the United States and four continents. We specialize in mass-producing startup micro and nonemployer businesses in underserved and under-resourced communities. Since most poor communities can not attract large $100,000,000-level industries, Jobenomics has turnkey programs that can mass-produce one thousand $100,000 per year businesses that produce many more jobs than an equivalent $100,000,000 enterprise.
One under-reported government program that deserves extra special attention involves leveraging investments to help entrepreneurs.
On 21 January 2021, during the U.S. Senate hearing on Dr. Janet Yellen’s nomination for Secretary of Treasury, Dr. Yellen stated President Biden is committed to increasing funding for aspiring entrepreneurs in underserved communities and without existing banking relationships.[14] According to Secretary Yellen, in addition to the $15 billion in small business grants, the Biden Administration plans to leverage $35 billion in government funds to $175 billion in additional small business lending and investment to help entrepreneurs.
Dr. Yellen did not provide details on how the Administration’s plans to create and deploy this hypothetical $175 billion fund. Nevertheless, Jobenomics is pleased that our Treasury Secretary is a former Fed Chair who can effectively orchestrate a synergistic monetary and fiscal strategy. Her views on leveraging government (and private sector) funds to energize entrepreneurs and startup enterprises are what our country desperately needs now.
Jobenomics also supports Secretary Yellen’s G7 pledge for continued international financial support and saying that “the time to go big is now.” Developing nations in Africa and South America are especially vulnerable to this COVID-19 and its mutations. The United States can be safe only if developed countries collectively eradicate the coronavirus worldwide. As an aside, Jobenomics assists its chapter leaders in Columbia, West Africa, and Mexico regarding testing and diagnostic equipment to identify infected individuals and quell hotspots that are superspreaders and incubators for COVID mutations.
Department of Biological Security?
Bill Gates warns that “this pandemic is bad, but a future pandemic could be ten times more serious,” and “stopping the next pandemic will require spending tens of billions of dollars a year.”[15] Jobenomics agrees wholeheartedly.
As mentioned in Part I of this COVID 2021 Report, on 5 March 2020, this author hand-carried the world’s leading COVID-19 antibody rapid point-of-care test kit to the U.S. Centers for Disease Control and Prevention (CDC) in Atlanta and has been involved in combating this virus ever since.
Consequently, it is of great concern that the U.S. government failed to include a single line-item in their $13 trillion stimulus package related to a U.S. Department dedicated to preparing for the next natural or human-made biological event that is sure to come.
For lack of a better name, a Department of Biological Security is as important as the newly inaugurated U.S. Space Force or the U.S. Cyber Command. As with other security departments, this Department would be responsible for early detection, prevention, mitigation, and recovery from natural pandemics. It would also be responsible for planning and executing response options to planned biological warfare attacks.
Public and private leaders worldwide state that we are at “war” with pandemics. The use of terms and phrases like combat, battlefields, invasion, war footing, war rooms, and war cabinets connotate a clear and present national security threat. On 27 January 2021, the COVID Grim Reaper claimed as many Americans (418,500) as were lost in WWII. As detailed in this report, the Reaper is still on the warpath looking to double this number with his mutant proxies.
Whether COVID-19 was a naturally-occurring virus or a human-engineered biological weapon is a moot question. What we do know is that we can engineer these deadly viruses. Given the fact that every developed country has national programs to create vaccines, they can just as quickly weaponize these programs. If not now, biological weapons will soon be the WMD (weapon of mass destruction) weapon of choice of rogue nations and terrorist groups.
From a Jobenomics perspective, we are at war with a biological enemy, and establishing a Department of Biological Security is not only warranted but blatantly irresponsible not to do so.
Tyranny of Trillions$
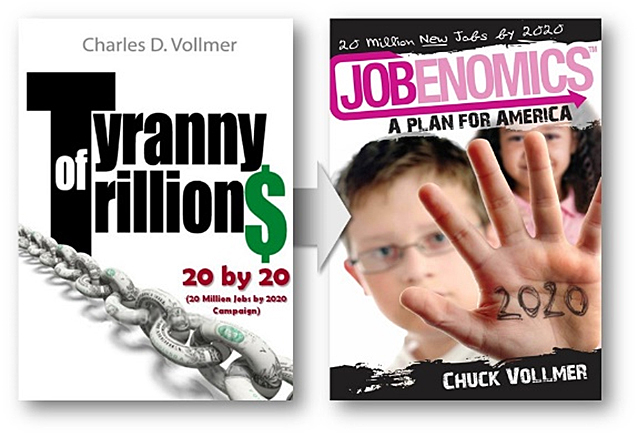
Before publishing Jobenomics in 2010, the manuscript’s title was Tyranny of Trillion$.
As stated in the book’s preface, the world’s richest and wisest man once said that a borrower becomes the lender’s slave. He also added that prudent man sees danger and takes refuge, but the simple keep going and suffer for it. These words are as valid today as during King Solomon’s reign.
The tyranny of a hundred trillion dollars of debt has altered America’s future. America evolved from the largest creditor nation to the largest debtor nation in history. A hundred trillion dollars of U.S. national debt ($28T), personal debt ($21T), obligations ($50T unfunded liabilities of Social Security and Medicare alone), and out-of-control spending place America in great peril.
Before addressing our national debt, one must first comprehend the sheer magnitude of a trillion dollars. A trillion is a million million, 1,000,000,000,000 or #1 followed by twelve zeros. A trillion $1-bills placed end-to-end would circle the Earth 4,000-times. Our 28 trillion $1-bills (the size of the U.S. national debt) set end-to-end would orbit the Earth and the Sun 15-times. Thus, the ramification of trillions of dollars poorly spent is far-reaching. Misspending $1 trillion is equivalent to eliminating Florida’s or Mexico’s entire economy.
To finance federal government activities, the U.S. Treasury issues securities—collectively labeled debt held by the public—that pay interest until redeemed by the holder and paid by the government. According to the Congressional Budget Office, the interest payment in the public’s debt in 2020 was $345 billion. By 2031, the CBO projects annual interest payments at $799 billion—perhaps a lot more if interest rates increase.
U.S. National Debt Growth By President
Sources: Federal Reserve Bank of St. Louis[16], COVID Money Tracker
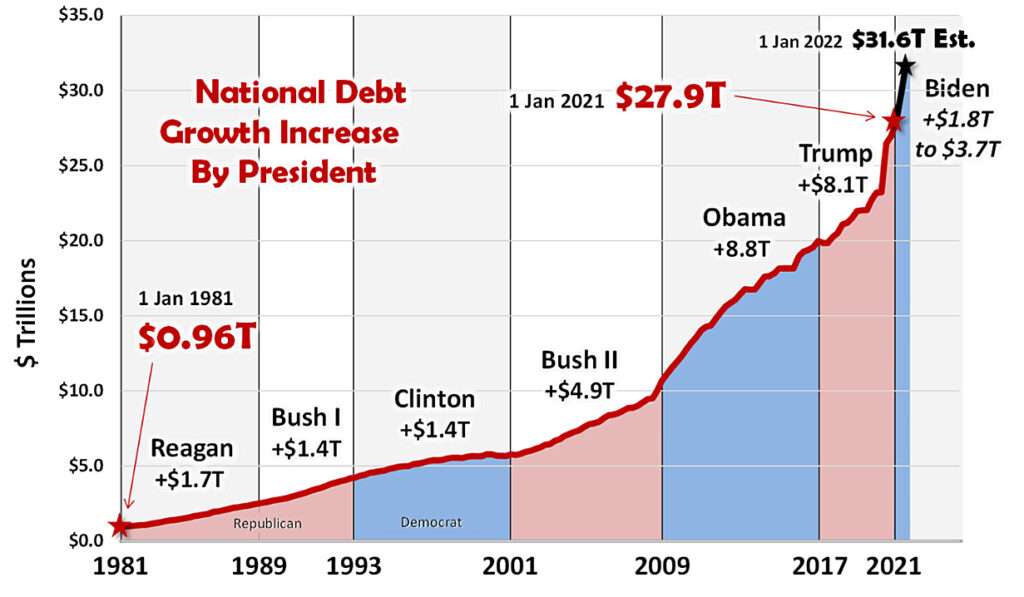
This chart is derived from Fed data and shows gross federal debt (aka, national debt), or all debt the federal government owes, including what it owes to itself. Specifically, gross federal debt is the sum of debt held by the public and intragovernmental debt (mostly trust funds like Social Security).
As shown, over the last two decades, the U.S. national debt skyrocketed. COVID 2020 increased the national debt by $3 trillion. COVID 2021 is on track to add several trillion, not including a trillion-dollar infrastructure bill, and the tens of trillions of dollars worth of social programs like universal minimum wage and healthcare, tuition-free college education, and climate change initiatives.
According to the people’s choice in the 2020 Presidential and Congressional elections, Americans voted for more social programs. Policymakers must now decide which programs are nice-to-have or need-to-have. From a Progressive Democrat perspective, the time is now for a full-throttled approach while the Democrat party controls the White House and Congress. Financing all the programs on the progressive agenda would likely drive up the national debt to $40T by the end of President Biden’s first term in office. Is the risk of a financial meltdown worth it? For those who think America needs a new vision and a fundamental reset, the answer is probably yes. Jobenomics advocates a more pragmatic approach to fixing problems and addressing challenges.
From a Jobenomics standpoint, the full-throttled approach is risky considering our decaying workforce and small business base that are the drivers of the U.S. economy. The infusion of large sums of money into the economy to respond to the pandemic and drive social change may yield a prolonged period of stagflation.
Stagflation is an economic period characterized by weak or negative GDP growth, high unemployment, and high inflation. The most common cause of stagflation is when the government prints excessive amounts of currency and dramatically reduces interest rates to increase borrowing—actions that are happening now.
The last time the United States experienced stagflation was during the 1970s following the first oil shock in 1973 when OPEC quadrupled oil prices almost overnight. This shock resulted in five-quarters of negative U.S. GDP growth. A second oil shock occurred in the wake of the 1979 Iranian Revolution that caused a drop in oil production and a doubling of gasoline prices. While it is too early to predict, COVID 2020 and COVID 2021 are likely to precipitate similar shocks to the United States and global economies.
The 1970s stagflation led to creating the Misery Index (the sum of the inflation rate and unemployment rate), a simple economic indicator of the amount of hardship imposed on society. Before the OPEC oil embargo in 1972, the U.S. misery index was 8.87 during the Nixon Administration, rising to 17.38 two years later in 1975 during the Ford Administration, and peaked at 20.76 eight years later in 1980 during the Carter Administration. Since Carter, the misery index decreased with every subsequent President to a low of 5.44 in 2019 during the Trump Administration. Then came COVID-19. By April 2020, the misery jumped to 15.03 but receded to an average of 9.35 in 2020.[17]
A Misery Index above the mid-teens will significantly impact the Biden Administration’s ability to govern relatively unconstrained. As discussed throughout this report, Jobenomics believes that the unemployment rate will be above 10% by midyear. If the inflation rate stays steady at 2.2%, the Administration’s Misery Index will be 12.2, borderline high but tolerable. If the post-pandemic economic recovery does not transpire this year, the prospects for a Misery Index between 17.0 and 20.0 in late 2021 or 2022 are foreseeable.
To help keep the inflation rate low, the Fed adopted an “all in” posture to support economic and employment growth using all its resources to keep long-term inflation “well-anchored” at 2%. At the 26 January 2021 FOMC meeting, the Fed maintained its near-zero fed funds rate at a range of 0% to 0.25, potentially through 2024. The Fed is also continuing to purchase $80 billion of Treasury securities and $40 billion of mortgage-backed securities every month to further progress toward maximum employment and price stability. Hopefully, these tactics will keep the economy stable, and inflation will not get out of hand.
In conclusion, Jobenomics is not as confident as most economics about the U.S. government’s ability to control the U.S. economy when it is spending trillions of dollars fighting a fire (COVID-19) that is still not contained. Moreover, a crisis often begets new crises. As said by Winston Churchill, never waste a good crisis. From a Jobenomics viewpoint, this crisis gives us a sterling opportunity to create next-generation businesses and careers and take the necessary actions to prepare and respond to the next biological event.
Stay tuned for Part IV of this COVID 2021 report that discusses the need to reallocate a portion of the remaining federal stimulus funds to mass-produce startup businesses that can flourish in the new normal.
Jobenomics deals with the economics of business and job creation. The non-partisan Jobenomics National Grassroots Movement’s goal is to facilitate an environment that will create 20 million net new middle-class U.S. jobs within a decade. The Movement has reached an estimated audience of 30 million people. The Jobenomics website contains numerous books and material on mass-producing small businesses and jobs and valuable content on economic and industry trends. For more information, see Jobenomics.com.
[1] The COVID Tracking Project, Totals for the US, retrieved 16 February 2021, https://covidtracking.com/data/national
[2] The University of Oxford, Oxford Martin Programme on Global Development, Our World In Data, Daily New Confirmed COVID-19 Cases and Deaths, United States, 7-Day Rolling Average, retrieved 16 February 2021, https://ourworldindata.org/grapher/daily-covid-cases-deaths-7-day-ra?time=2020-01-02..latest&country=~USA
[3] Note: Jobenomics uses and cross-checks a variety of officially recognized United States and European databases.
[4] The COVID Tracking Project, U.S. All Key Metrics, retrieved 16 February 2021, https://covidtracking.com/data/charts/us-all-key-metrics
[5] CDC, COVID Data Tracker, Number of People Receiving 2 Doses, 29 January 2021, https://covid.cdc.gov/covid-data-tracker/#vaccinations
[6] U.S. Bureau of Labor Statistics, Economic News Release, Table A-1, https://www.bls.gov/news.release/empsit.t01.htm
[7] U.S. Bureau of Labor Statistics, 9 December 2020, Table 1. Job openings levels and rates by industry and region, seasonally adjusted https://www.bls.gov/news.release/jolts.t01.htm
[8] Bloomberg, Economics, Powell Urges ‘Society-Wide’ Push to Deliver Full Employment, 10 February 2021, https://www.bloomberg.com/news/articles/2021-02-10/powell-says-full-jobs-recovery-will-require-more-government-aid?srnd=premium
[9] Committee for a Responsible Federal Budget, COVID Money Tracker, retrieved 1 January 2020, http://www.crfb.org/project/covid-money-tracker
[10] Board of Governors of the Federal Reserve System, Credit and Liquidity Programs and the Balance Sheet, retrieved 10 February 2021, https://www.federalreserve.gov/monetarypolicy/bst_recenttrends.htm
[11] Committee for a Responsible Federal Budget, COVID Money Tracker, retrieved 1 January 2020, http://www.crfb.org/project/covid-money-tracker
[12] San Francisco Business Times, Largest San Francisco Employers, 3 January 2020, https://www.bizjournals.com/sanfrancisco/subscriber-only/2020/01/03/largest-san-francisco-employers.html
[13] ADP Research Institute, ADP National Employment Report, January 2021, https://adpemploymentreport.com/
[14] U.S. Senate, Committee on Finance, Hearing on the nomination of Dr. Janet Yellen, Page 6, 21 January 2021, https://www.finance.senate.gov/imo/media/doc/Dr%20Janet%20Yellen%20Senate%20Finance%20Committee%20QFRs%2001%2021%202021.pdf
[15] Entrepreneur, Bill Gates Warns That a Next Pandemic Could Be 10 times Worse, 28 January 2021, https://www.entrepreneur.com/article/364371
[16] Federal Reserve Bank of St. Louis, Federal Debt: Total Public Debt, Millions of Dollars, Quarterly, Not Seasonally Adjusted, retrieved 10 February 2021, https://fred.stlouisfed.org/series/GFDEBTN
[17] United States Misery Index, http://www.miseryindex.us/indexbyyear.aspx

