
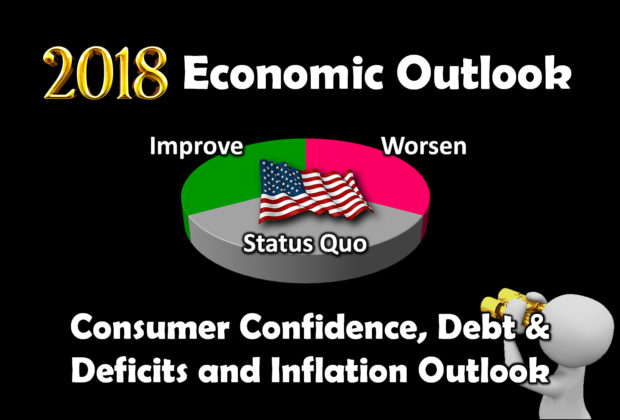
Economy: Consumer Confidence, Debt & Deficits, and Inflation. The Jobenomics 2018 U.S. Economic Outlook predicts an equal probability (33.3%) for economic improvement, maintaining the status quo, or an economic slowdown in 2018. This assessment is based on a detailed analysis of six strategic considerations: Economy, Business, Labor Force, Governance, Domestic Disruptors and International Disruptors. This posting deals with three macroeconomic factors impacting the Economy: Consumer Confidence, Debt & Deficits, and Inflation. The entire 60-Page Jobenomics 2018 U.S. Economic Outlook report can be downloaded free from the Jobenomics Library
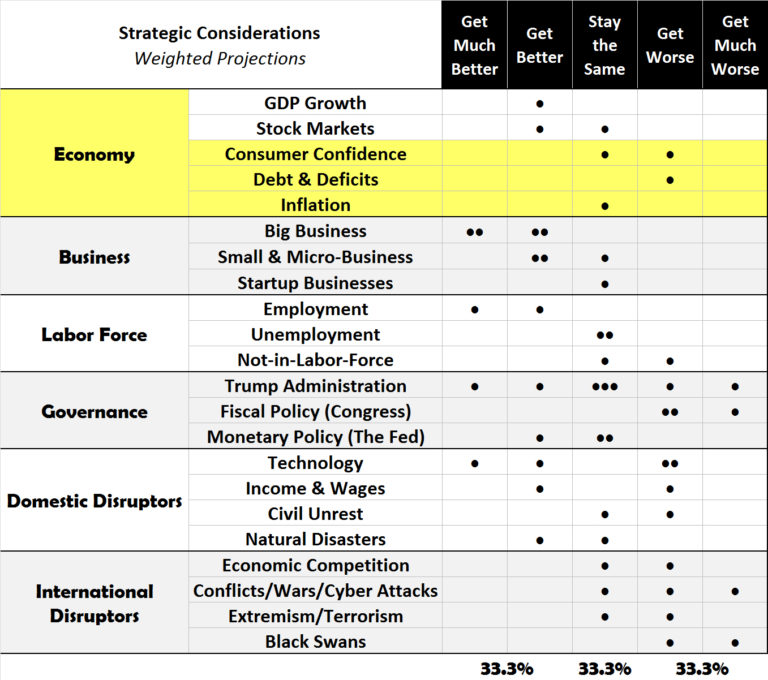
Jobenomics 2018 U.S. Economic Outlook Matrix
Consumer Confidence. For 2018, Jobenomics believes that consumer confidence will either maintain its historical high or drop slightly over the course of the year.
Consumption is an economic function defined as the value of all goods and services bought by people. Leading economists determine the financial performance of a country by calculating consumption levels and consumer dynamics. In 2017, U.S. personal consumption expenditures exceeded $13.4 trillion.
As measured by the Consumer Confidence Index, a measurement of consumer dynamics, U.S. consumer confidence reached a 17-year high in November 2017, which is one of the primary factors for current enthusiasm about the strength of the U.S. economy.
Consumer confidence is essential to the extent that it is the driving force for people to spend their hard-earned money to buy goods and services that generate economic growth. However, the consumer confidence index is an idiosyncratic measurement of financial health since it is a measurement regarding how consumers “feel” rather than what they “know” about the economy. So, this index should be taken with a grain of salt since feelings change rapidly.
America is a consumption-based and market-driven society. Consequently, consumer confidence is directly related to personal consumption spending. Personal consumption represents the vast majority 69% of U.S. GDP in 2017. Government consumption and expenditures (17%), private domestic investment (17%), and net U.S. imports/exports (-3%) represent the remaining 31%.
The underlying theory of a consumption-based economy is that progressively higher consumption of goods and services is beneficial. Jobenomics believes that this argument is only partly correct. Production, not consumption, is the real source of wealth. Production uses resources to create goods and services that are suitable for use or exchange in a market-driven economy. If we truly want a healthy economy, America needs to create the conditions under which producers (businesses as opposed to governments) can accelerate the process of creating wealth for others to consume and deploy profits to recapitalize operations or enhance productivity.
In America’s pre-consumer era, the U.S. economy consisted of agriculture and cottage industries that first produced what citizens needed and then traded the rest. Non-essential consumption was mainly the privilege of an elite few. Over the ensuing centuries, consumerism began to dominate the American economic equation as the masses yearned for more and better products and services. Today, consumption is no longer a privilege but a necessity. Increased spending is essential to keep the U.S. economy growing.
Without increased consumption, the economy will falter. For every percentage point change in yearly GDP growth, approximately 1.5 million jobs are gained or lost. The Great Recession validated this math. During the 18-month long Great Recession, America’s GDP dropped 5.5% resulting in the loss of 8.7 million jobs.
To achieve President’s Trump’s goal to produce 25,000,000 new jobs over the next 10-years, the Administration must increase GDP by 1.7% per year (1% GDP growth = 1.5 million jobs per year, 1.7% GDP growth = 2.5 million jobs per year or 25,000,000 new jobs in 10-years). Since the average annual rate of GDP growth this decade is 2.3%, the Administration must achieve an annual 4.0% GDP growth rate to meet the 25,000,000 new jobs goal.
Debt & Deficits. Overspending and neglecting to bring fiscal accounts into balance is an existential threat to the U.S. economy. Regrettably, debt and deficit reductions are issues that public officials and the American public tend to ignore.
There are two major categories of deficits: spending and trade. Deficit spending practiced by the federal government is out of control. All the states except Vermont have a legal requirement for a balanced budget. The federal government does not have a balanced budget requirement and is racking up unsustainable amounts of debt. The same applies to trade deficits.
On average, federal spending deficits and trade deficits amount to about $1 trillion per year. $1 trillion is the equivalent of 10,000,000 jobs per year calculated at $100,000 per job (wages, benefits, overhead). Instead of deploying this trillion dollar bounty to job creation, the United States uses half for often-worthy but mostly-capricious politically-oriented handouts. The other half is allowed to migrate overseas to create foreign jobs, businesses, and infrastructure.
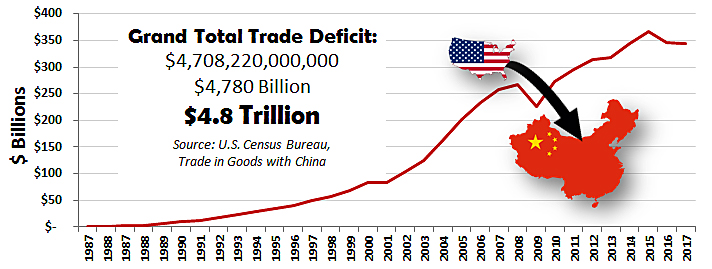
U.S. Trade Deficit History with China
The claim that the United States financed the Chinese economic miracle that raised 700 million people out of poverty is mostly valid.
According to the U.S. Census Bureau’s Trade in Goods with China database, the U.S. trade deficit increased from $0 in 1985 to $350 billion per year today. Since 1985, the total U.S.-China deficit amounted to an incredible trade imbalance of $4.8 trillion (not adjusted for inflation). $4.8 trillion equates to 320 million Chinese jobs calculated at $15,000 per job, or roughly half of the 700 million Chinese raised out of poverty. This rough calculation makes the point that trade deficits hurt the American labor force and the economy. It also explains some of the reasons for the erosion of the American middle-class and the loss of much of the U.S. manufacturing base over the last three decades.
China has not only dominated the U.S. trade balance in goods and services but in intellectual capital as well. A February 2017 report by the Commission on the Theft of American Intellectual Property states the intellectual property theft (cyber theft, counterfeit goods, software piracy and trade secrets theft) costs the American economy as much as $600 billion a year with the vast majority attributed to the Chinese government. Two highly credible individuals, Dennis Blair (former Director of National Intelligence and PACOM Commander) and Jon Huntsman (former Ambassador to China, Governor, Deputy Trade Representative, and Presidential Candidate) chair this commission. According to the report, in addition to annual financial losses of up to $600 billion per year, intellectual property theft causes tens of millions less U.S. jobs, suppression of GDP growth and innovation.
Over the last five decades, total U.S. debt (government, business, financial and individual) has grown from a luxury for a few to an addiction to all. Compared to the current U.S. GDP of $20.5 trillion, total U.S. debt has now reached an all-time high of $67 trillion, up from $4 trillion in 1967 and $27 trillion at the turn of the Century, as reported by the U.S. Federal Reserve System of St. Louis. U.S. national debt equals about one-third of total American debt whereas private sector (household and corporate) debt is responsible for the remaining two-thirds.
U.S. National Debt Growth by President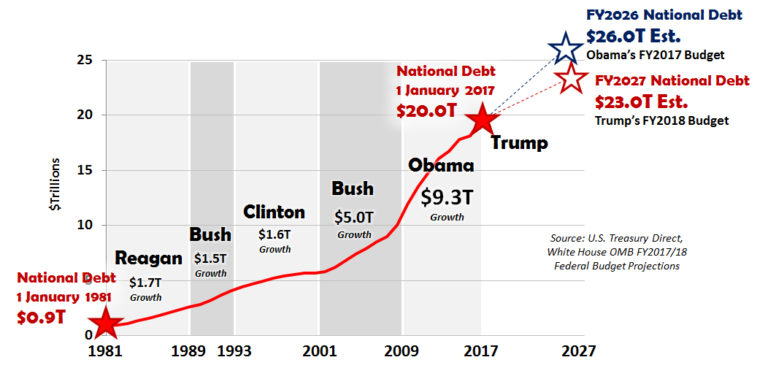
U.S. national debt increased from $0.9 trillion when President Reagan took office to $20.5 trillion on 1 January 2018. Presidents Reagan, Bush Sr. and Clinton’s debt increases were relatively minor, totaling $1.7T, $1.5T and $1.6T respectively. During President G.W. Bush’s tenure, national debt growth increased by $5.0T. During President Obama tenure, national debt skyrocketed by $9.3T.
When President Trump took office, the national debt was $20.0 trillion and grew by $0.5 trillion during his first year in office. According to the Trump Administration’s FY2018 Budget request, the projected size of the national debt is estimated to be $23.0 trillion by FY2027, which is $3.0 trillion less than the Obama’s Administration FY2026 forecast. The Tax Cuts and Jobs Act is projected to increase debt by $1.5 trillion over the next decade. However, the Tax Cuts and Jobs Act as advertised is expected to grow the economy and become budget neutral by 2027. The President’s FY18 Budget calculates deficit spending at $3.2 trillion over the 2018 to 2027 timeframe with a projected 2018 deficit of $404 billion.
After a brief decline after the Great Recession, the New York Fed reports that household debt set a new record high of $13.4 trillion in 2017. $13.4 trillion is approximately two-thirds the size of America’s national debt, which makes the debt problem doubly worrisome. At $8.7 trillion, mortgage debt is the most significant household debt category, which places 48 million homeowners at risk if the current housing bubble unexpectedly bursts. Student school loan debt increased 157% from $0.5 trillion in 2007 to $1.4 trillion as of Q3 2017. The average monthly student loan payment for 44.2 million borrowers is approximately $351 per month. The remaining 20% of household debt consists of auto loans ($1.2T), credit card debt ($0.8T), home equity loans ($0.4T) and various other forms of indebtedness ($0.4T).
Excessive debt is not only an American challenge. According to the IMF, global combined debt (government, household, and nonfinancial firms—not including the financial sector) is at an all-time high at 225% of world GDP, or $152 trillion. Two-thirds of global combined debt, amounting to about $100 trillion, consists of liabilities in the private sector. Quoting the IMF, “The sheer size of (private sector) debt could set the stage for an unprecedented private deleveraging process that could thwart the fragile (global) economic recovery….Financial crises tend to be associated with excessive private debt….It is clear that meaningful deleveraging will be very difficult without robust (GDP) growth.”
As scary as this IMF prediction is, it does not include the unimaginable debt associated with the too-big-to-fail financial sector. The financial industry includes commercial banks, shadow banks (hedge funds, money-market mutual funds), and financial intermediaries (insurance companies, pension funds)—all of which pose a near-term $50 trillion global financial risk.
Then there is the invisible financial behemoth called derivatives. Derivatives are primarily unregulated financial instruments based on the perceived future value (hedges and bets) of underlying assets like stock, bonds, mortgages, currencies, interest rates. Derivatives also include a variety of exotic options (a derivative which is more complicated than commonly traded “vanilla” products) such as Compound, Barrier, Lookback, Chooser and Rainbow options.
Investopedia estimates the size of the derivatives market at $1.2 quadrillion ($1,200 trillion), which equates to over 10-times world GDP or 60-times U.S. GDP. Derivatives caused the sub-prime mortgage crisis that led to the 2007 Great Recession and global financial crisis. Derivatives are likely to be a significant contributor to a potential future economic crisis.
Since the Great Recession, government debt increased by 50% in advanced economies. Following the trend set by the United States, other nations printed vast amounts of money, lowered interest rates, bought weak financial assets, and spent lavishly on overpriced infrastructure projects (especially in China) to stimulate GDP growth. In the short-term, these efforts elevated consumption, increased the market value of 60 major stock exchanges throughout the world, and inflated the value of real estate in major metropolitan areas (a 1,000 square foot condo in upscale London now costs about $4 million). All of these actions significantly increased global debt.
The fact that America has gone from the world’s largest creditor nation to the most prominent debtor nation in the last three decades is sobering. While people are familiar with the miracle of compound interest (where money makes money on money), few grasp the anathema of compound debt (debt that begets more debt). Albert Einstein said that the principle of compound interest is one of the most potent forces in the universe. Einstein would consider the anathema of compound debt to be equally valid.
Compounding debt is upending American institutions. Insurance companies can longer cover liabilities (e.g., U.S. insurance companies are exiting Obamacare in droves). Pension funds are grossly underfunded (e.g., U.S. state and local pension funds have up to $3 trillion of unfunded commitments). Ten U.S. cities have gone bankrupt. States, like Illinois, are on the verge of defaulting on their mountains of debt. Welfare programs are on the road to insolvency (e.g., Medicare is projected to be insolvent within 10-years). Debt is cancer that continues to metastasize in the U.S. economy. Surgery is not the only option. Economic growth is an antidote.
In conclusion, Jobenomics believes that deficits and debts will get worse in 2018. Jobenomics also predicts that 2018 will be a seminal year for deficit and debt policy-making. If President Trump is successful in executing his economic, workforce and trade policies, America might be able to turn the corner on these cancerous fiscal challenges. If the Trump Administration is unsuccessful, the future for deficit/debt reduction looks bleak.
Inflation. Most prognosticators do not see inflation as a significant issue in 2018. Jobenomics agrees.
Inflation is a key economic indicator. Rising prices and decreased value of money are the hallmarks of inflation. Positive inflation in the 1% to 2% range is considered normal. Rates above 3% are considered abnormal and trigger government intervention by the Federal Reserve. The Federal Reserve judges the ideal rate of inflation at 2%. The current inflation rate for the United States is 2.2%.
A broader definition of inflation includes deflation, stagflation, super-inflation, and hyperinflation.
- A persistent decrease in the price level of goods and services causes deflation. Deflation leads to lower production, consumption, and Japan has been fighting a deflationary spiral since the 1980s when its real estate bubble burst. In 1980, the total land value of greater Tokyo was estimated to be equal to the land value of the rest of the world.
- Stagflation is an economic condition of both chronic inflation and stagnant business activity, resulting in high unemployment rates. Stagflation was an American financial phenomenon in the 1970’s resulting from a combination of economic stagnation, rising prices, and The cause of the 1970’s stagflation was increasing global competition from countries fully recovered from the devastation of WWII. Three U.S. Administrations (Nixon, Ford, Carter) failed to curb stagflation. President Reagan’s supply-side economics and tax cuts, known as Reaganomics, broke the stagflation and helped the economy to recover.
- Super-inflation is very high, above 10%, but not out-of-control inflation. Hyperinflation is super-inflation on steroids that causes economies to collapse. In hyperinflation, prices drastically increase as currency plummets in value. Economic depressions, wars, and loss of confidence in a nation’s paper currency are common hyperinflation triggers. A massive increase in money supply, not supported by growth in the output of goods and services, is often associated with
In the last 20 years, several dozen economies have collapsed due to hyperinflation. With the exception of Russia in the 1990s and Argentina in the 1980s, all other hyperinflation collapses were in small third-world countries or countries ravaged by war. Barring a financial reset or crisis, Jobenomics does not foresee any of these inflationary scenarios happening in 2018 but is carefully watching unfolding events that could trigger such situations.
While deflation, stagflation, super-inflation, and hyperinflation are unlikely in 2018, they are essential matters to consider. While the U.S. economy seems to be resistant to these maladies, other parts of the world are less immune. Contagion can spread quickly throughout the global economy.
Since Washington cannot bring itself to cut spending, the alternative is to grow the economy prodigiously. From a Jobenomics perspective, President Trump’s sustained 4.0% GDP growth vision is not only needed but necessary to reduce soaring debt. On the other hand, there is another alternative to lowering massive indebtedness if the economy fails to grow at prodigious rates.
Throughout history, nations used inflation as a debt reduction weapon. Homeownership provides an excellent example. The real money value of fixed-price mortgages decreases in proportion to the rate inflation, which constitutes a sound financial reason for homeownership during periods of high inflation. On the other hand, homeownership during deflationary periods is fiscally unsound.
However, rising inflation is hard to control, which is the reason that the Fed gives inflation so much attention. Runaway inflation leads to super-inflation and hyperinflation that wipes out debt but destroys the economy. The most recent and worst examples of runaway inflation occurred in Zimbabwe in 2008. During the height of Zimbabwe’s economic crisis, it only took a little more than one day for the prices of essential goods to double in price. To combat rising anger and extinguish the raging hyperinflation, the Zimbabwe government began printing trillion dollar inflation sets of $10T, $20T, $50T and $100T notes (dollar bills)—the biggest notes in financial history.
About Jobenomics: Jobenomics deals with the economics of business and job creation. The non-partisan Jobenomics National Grassroots Movement’s goal is to facilitate an environment that will create 20 million net new middle-class U.S. jobs within a decade. The Movement has a following of an estimated 20 million people. The Jobenomics website contains numerous books and material on how to mass-produce small business and jobs as well as valuable content on economic and industry trends. For more information see https://jobenomics.com/ .

