
The gender pay gap is a highly-charged political and social issue. Unfortunately, few Americans fully understand the data behind gender income inequality. While it is true that American men make more than women, the gap is narrowing. In 2016, American women earned only 2.4% less, or 98 cents on every dollar, than men in similar jobs, according PayScale, a leading U.S. online compensation information company.[1] This 2.4% figure is a far cry from the widely advertised 76% number by activists. On the other hand, across all jobs in the United States, PayScale estimates that women earn 23.7% less or 76% for every dollar earned by men. To take a deeper dive into gender gap statistics, Jobenomics analyzed gender income and earnings based on official government data reported by the U.S. Census Bureau and the Bureau of Labor Statistics. Download this report @ Gender Gap, 14 October 2017
Female-to-Male Earnings Ratio and Median Earnings of Full-Time,
Year-Round Workers 15 Years and Older by Sex: 1960 to 2016
Source: U.S. Census Bureau, Income and Poverty in the United States: 2016[2]
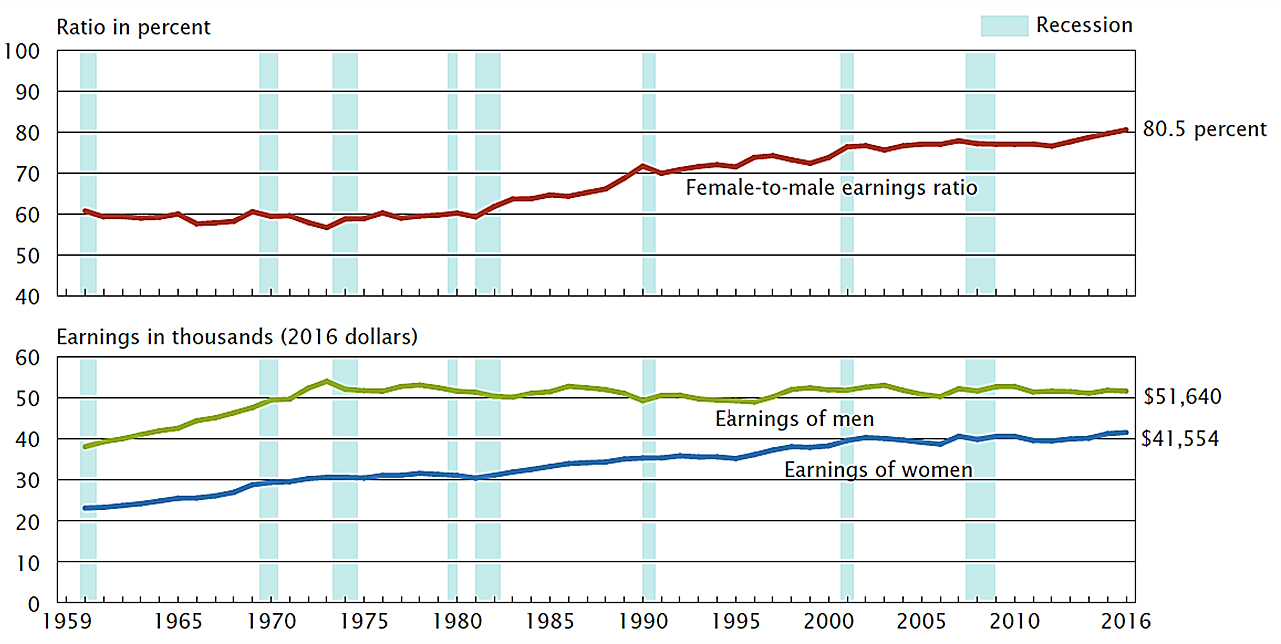
According to the Census Bureau’s 2016 Income and Poverty in the United States report women are closing the gap between the sexes over the last six decades. As shown, in terms of median income, since 1960, American females have narrowed the female-to-male earnings ratio gap from 60% to 80.5% in 2016 based on real median earnings of men ($51,640) and women ($41,554) who worked full-time, year-round. This ratio is based on median earnings (an occupational median wage estimate is the boundary between the highest paid 50% and the lowest paid 50% of wage earners) as opposed to mean earnings (an average wage; an occupational mean wage estimate is calculated by summing the wages of all the employees and then dividing the total wages by the number of employees).
Median versus Mean Earnings by Sex in 2016
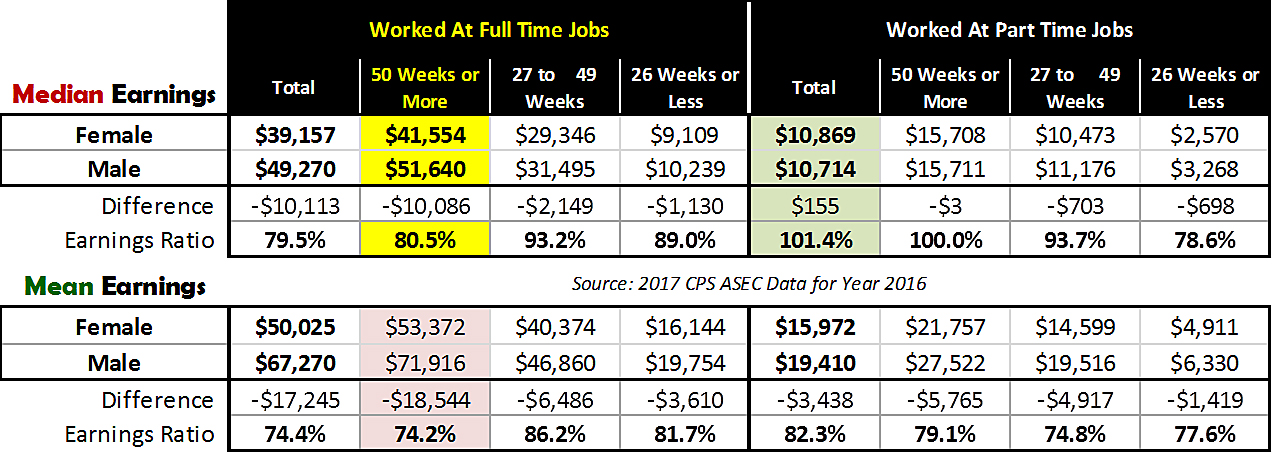
This chart, derived from 2017 CPS ASEC raw data by Jobenomics, shows in greater detail the differences between the 164.6 million American males and females who received earnings in 2016.
- Median (middle) earnings data for people who worked at full-time jobs for 50+ weeks per year is highlighted in dark yellow, and shows that the 80.5% female-to-male earnings ratio metric in relation to other full-time and part-time work data. With the exception of the total part-time work category, highlighted in light green, women earned less than their male counterparts.
- Mean (average) earnings data, highlighted in light red, places the female-to-male earnings ratio at 74.2% for full-time yearly workers. In terms of mean earnings, women earned less than their male counterparts in all listed categories.
Median household income is the single most widely used measure of income by the Census Bureau. Medians are often viewed as a better central measure than means, which can be distorted by a small number of extremely large values. For the purposes of this report, Jobenomics prefers means over medians since these “distortions” are important in understanding gender income inequality. In 2016, real median earnings of men ($51,640) and women ($41,554) was significantly different from the real mean earnings of men ($71,916) and women ($53,372), which accounts for the difference between the 80.5% and 74.2% female-to-male earnings ratios.
Percent of U.S. Wage Earners Above & Below Mean Income in 2016
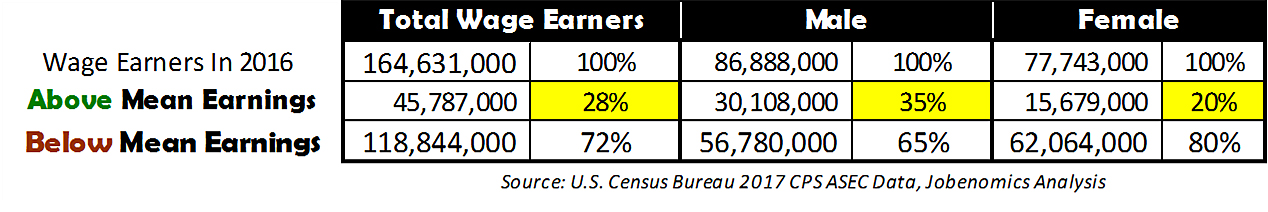
As highlighted in yellow, according to 2017 CPS ASEC data, out of a total of 164,631,000 American workers 15-years old and over with earnings, only 28% earned above mean earnings in 2016. In terms of gender, 35% of American male wage earners made above the mean compared to 20% of their female counterparts.
2016 Income Earnings Profile by Gender
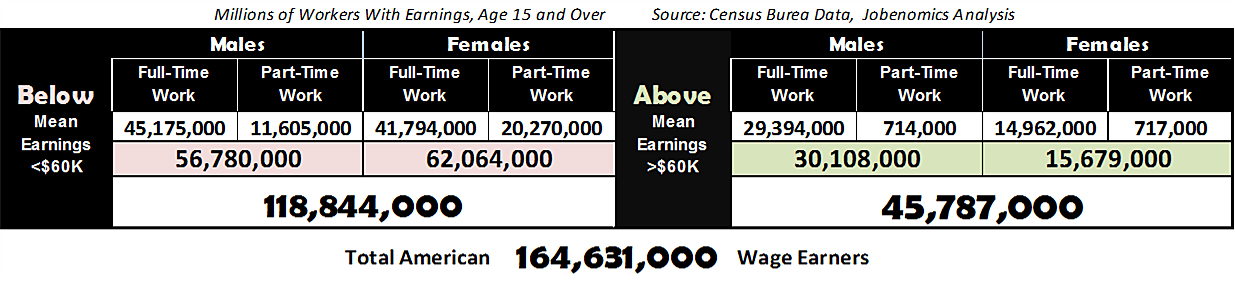
As highlighted in light red, the number of male workers earning below mean income was 9% lower than their female counterparts (56,780,000 versus 62,064,000). As highlighted in yellow, the number of males earning above mean income was 93% higher than females (30,108,000 versus 15,679,000).
Strategic Snapshot of 2016 Income Earnings by Gender
Source: 2017 CPS ASEC Supplement, PINC-05 Data, Both Sexes[3]
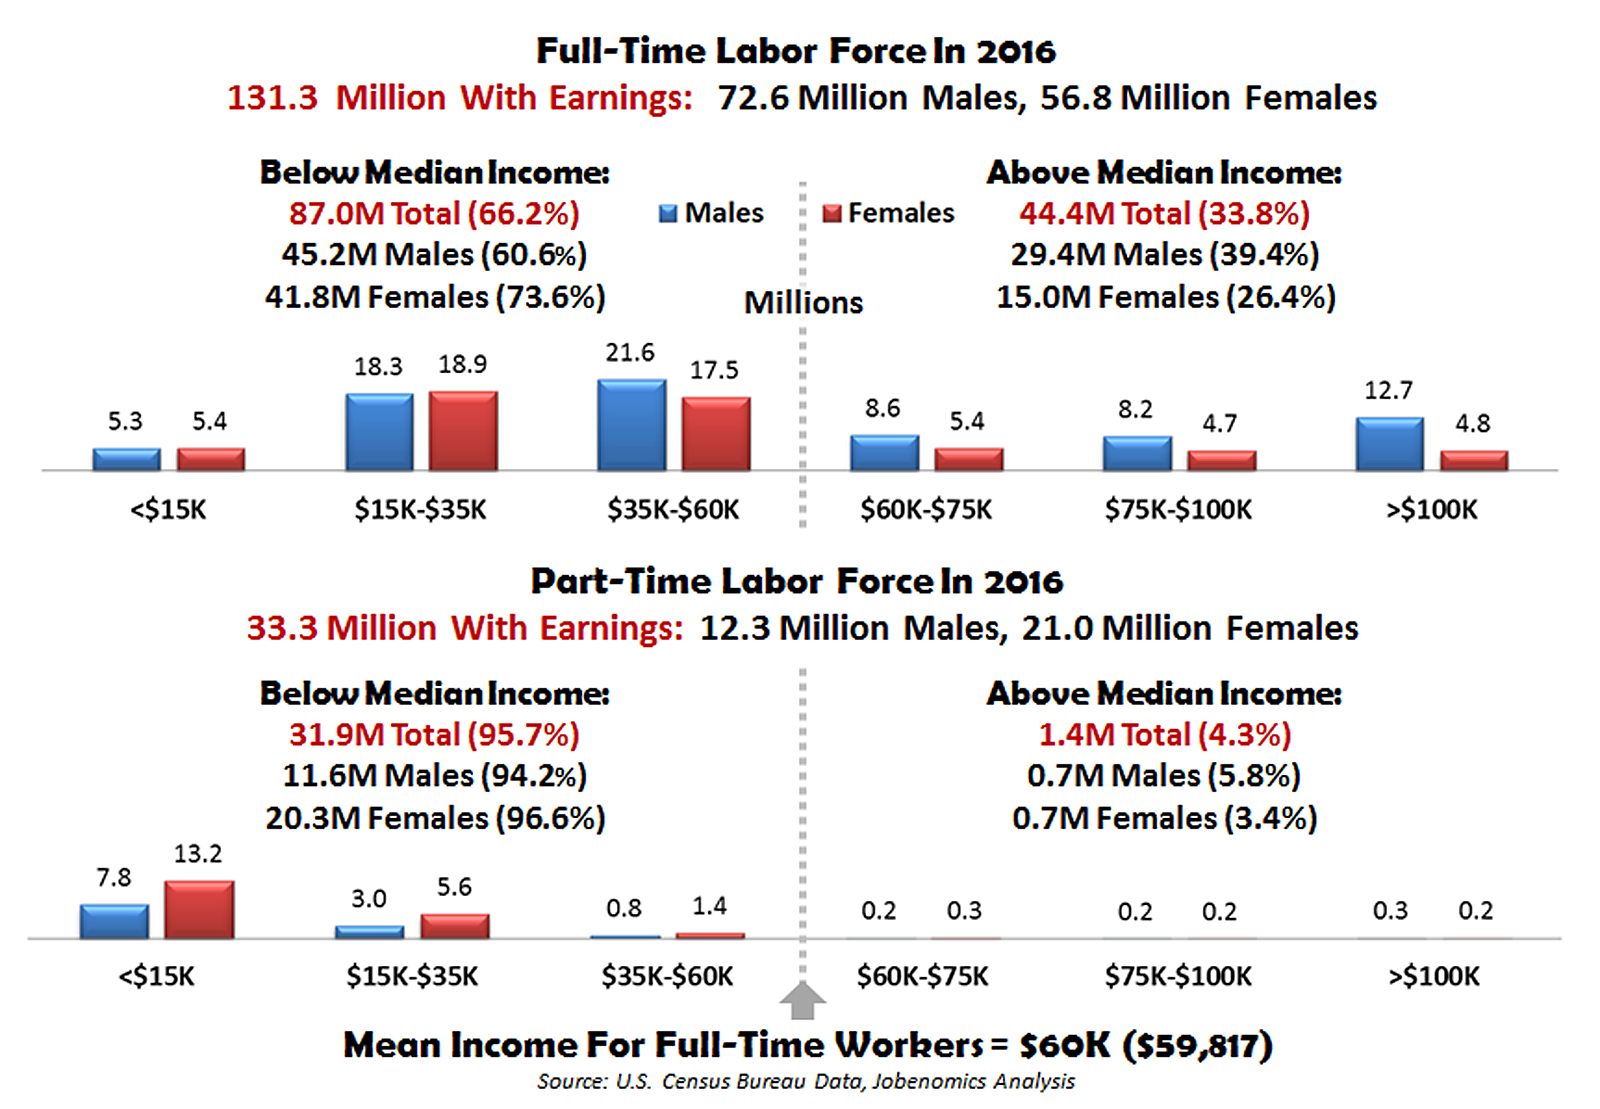
Out of a population of 324,000,000 in 2016, 164,631,000 Americans 15-years old and older worked with earnings. 80% (131,391,000) worked full-time and 20% (33,367,000) worked part-time during the work year. The full-time workforce was 57% male (74,609,000) and 43% female (56,783,000). The part-time workforce was 37% male (12,337,000) and 63% female (21,030,000).
There are six (<$15K, $15K-$35K, $35K-$55K, $55K-$75K, $75K-$100K, >$100K) categories for both sexes for the full-time workforce and six categories for the part-time workforce. Numbers and percentages for both sexes are shown for each of these twelve categories. While females tend to outnumber males in the lower wage categories and males outnumbered females in the higher categories, the differences are not substantial in the low wage categories but are noticeably larger in the high wage categories. The greater than $100K full-time category, males outperform females by a factor of 2.6-to-1 (12.7 million versus 4.8 million respectively).
66.2% of all wage earners (87.0 million) who worked at full-time jobs in 2016 earned below mean earnings. Within this group, 60.6% (45.2 million) of male wage earners and 73.6% (41.8 million) of female wage earners made below mean earnings.
95.7% of all wage earners (31.9 million) who worked at part-time jobs in 2016 earned below mean earnings. Within this group, 94.2% (11.6 million) of male wage earners and 96.6% (20.3 million) of female wage earners made below mean earnings. Surprisingly, female wage earners made more money than their male counterpart in the part-time categories. At the lowest (below $15K) category, females outperformed males by a factor of 1.7-to-1 (13.2 million versus 7.8 million respectively).
While the part-time workforce is currently only one-third the size of the full-time workforce, if Jobenomics is correct regarding the contingent workforce becoming the dominant form of U.S. labor in the near future, income disparity for low wage earners of both sexes will grow in importance and must be addressed now with actionable solutions.
Wage Earner Comparison by Gender
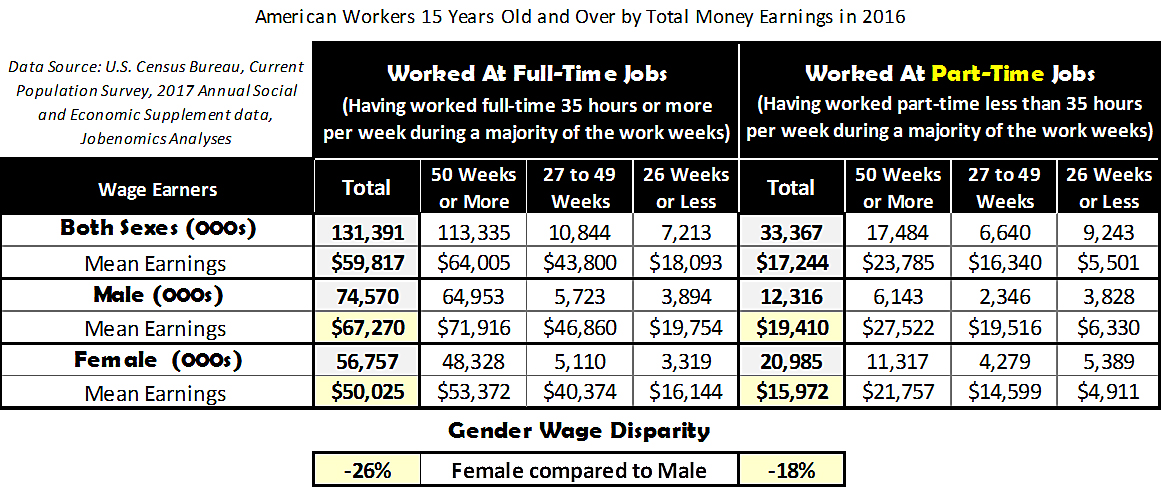
This wage earner comparison by gender chart provides more detailed information regarding the amount of time per week for both sexes relative to the mean income of $59,817.77F[4] What is most striking about this chart is that all full-timers are not working full-time due various reasons such as new entrants and reentrants, layoffs and illness. Only 86% (113,335,000 out of a total of 131,391,000 full-time workers) work 50 weeks or more a year. 14% or 18,057,00078F[5] work less than 49 weeks or less and are in actuality quasi-part-timers. Adding these 18,057,000 quasi-part-timers to the 33,367,000 workers who are officially classified as part-timers equals a grand total of 51,424,000 part-time workers. 51,424,000 is almost twice has high as the number of U.S. part-time workers (27,569,000) and 41% of the private sector workforce (124,051,000) as calculated by the BLS as 1 September 2017. 41% approximates the 40% contingent workforce calculation as discussed in this analysis and in the Jobenomics Comprehensive U.S. Labor Force & Employment Report.
As highlighted in light yellow on Gender Wage Disparity box at the bottom of the Wage Earner Comparison chart, for full-time workers, female mean earnings were 26% less than males ($50,025 versus $67,270). For part-time workers, female mean earnings were 18% less than males ($15,972 versus $19,410).
CPS ASEC data therefore supports the claim that females earn 72.4% (mean) to 80.5% (median) of the earning of their male counterparts for full-time equivalent workers. CPS ASEC data further indicates that females earned less across all work categories and were far more likely to work part-time. Consequently, female workers are poorer and more likely to be part of the contingent workforce than their male counterparts. These are extremely important issues that need to be rectified. However, these statistics do not adequately explain the critical question of why females earn less.
The fact that almost twice as many men make above mean earnings than women largely explains gender pay gap and is often cited as the basis for the “glass ceiling” argument (i.e., an intangible barrier within a hierarchy that prevents women from obtaining upper-level positions). According to the Korn Ferry Institute, a preeminent authority on leadership and talent, across all C-suite titles (CEO-Chief Executive Officer, CFO-Chief Financial Officer, CIO-Chief Information Officer, CMO-Chief Marketing Officer, CHRO-Chief Human Resources Officer) in six leading U.S. industries (Consumer, Energy, Financials, Life Sciences, Industrials and Technology) only 24% are occupied by women executives, ranging from a low of 1% of all CEOs to a high of 55% of all CHROs.[6]
There are many reasons cited for the glass ceiling ranging from male chauvinism to women’s choice of occupations. The U.S. female workforce is concentrated on generally lower paying jobs like teaching, nursing, secretarial and healthcare occupations that are approximately 80% female occupations. Women are also stymied by the so-called “motherhood penalty” that disadvantages women in highly competitive upper management positions that require long hours as a “sign of commitment and leadership potential”.[7] Regardless of reason, the overwhelming predominance of women in lower wage categories is one of the primary reasons that able-bodied women chose not to work as well as a major inducement towards welfare and other means of public assistance.
From a Jobenomics perspective, ethnology (cultural and relational differences) plays a major role on answering why females make less income. The diversity movement is narrowing the gap between female and male income inequities, but not fast enough to address the problem of an eroding American middle-class and energizing a lukewarm economy. To be more effective, the diversity movement needs to shift from its visible attributes orientation, such as gender and race, to more invisible attributes like parental, marital, socio-economic status, as well as educational, experiential, employment experience in order to craft solutions that will enhance the labor force.
To that end, Jobenomics emphasizes women-owned-businesses over women-in-business as a potential national initiative that will empower women to enter and succeed in the labor force with greater satisfaction and earnings. While there is nothing wrong with women pursuing opportunities with large established institutions, Jobenomics believes that many women will find greater opportunity and fulfillment by creating their own small and self-employed businesses that are tailored to their needs, lifestyles and expectations based on their invisible attributes and educational, experiential and employment experience. Contrary to common knowledge, the rate of employment growth and revenue of women-owned businesses has outpaced the economy and male-dominated businesses for the last three decades. In a gender-neutral digital economy, women can compete globally from home-based businesses in ways never before possible.
About Jobenomics: Jobenomics deals with economics of business and job creation. The non-partisan Jobenomics National Grassroots Movement’s goal is to facilitate an environment that will create 20 million net new middle-class U.S. jobs within a decade. The Movement has a following of an estimated 20 million people. The Jobenomics website contains numerous books and material on how to mass-produce small business and jobs as well as valuable material on economic and business trends. For more information see https://jobenomics.com/.
[1] PayScale, Gap Analysis, What Equal Pay Day Gets Wrong, https://www.payscale.com/data-packages/gender-pay-gap
[2] U.S. Census Bureau, Income and Poverty in the United States: 2016, issued September 2017, Figure 2, Page 9, https://www.census.gov/content/dam/Census/library/publications/2017/demo/P60-259.pdf
[3] U.S. Census Bureau, Current Population Survey (CPS) Annual Social and Economic (ASEC) Supplement,
PINC-05. Work Experience-People 15 Years Old and Over, by Total Money Earnings, Age, Race, Hispanic Origin, Sex, and Disability Status, Personal Income in 2016, Both Sexes 15 Years and Over, https://www.census.gov/data/tables/time-series/demo/income-poverty/cps-pinc/pinc-05.html
[4] People are classified as having worked part-time during the preceding calendar year if they worked less than 35 hours per week in a majority of the weeks during the year. Conversely, people are classified as having worked full-time if they worked 35 hours or more per week during a majority of the weeks in which they worked. Wages include total money earnings received for work performed during 2014. Earnings for self-employed businesses are considered wages.
[5] 10,844,000 + 7,213,000 = 18,057,0007
[6] Korn Ferry Institute, The gap at the top, Women in the C-Suite, 17 August 2016, https://www.kornferry.com/institute/the-gap-at-the-top?articles
[7] The Economist, The Gender Gap, Women still earn a lot less than men, despite decades of equal-pay laws. Why?, 7 October 2017, https://www.economist.com/news/international/21729993-women-still-earn-lot-less-men-despite-decades-equal-pay-laws-why-gender

