
The Jobenomics 2018 U.S. Economic Outlook predicts an equal probability (33.3%) for economic improvement, maintaining the status quo or an economic slowdown in 2018. This assessment is based on a detailed analysis of six strategic considerations: Economy, Business, Labor Force, Governance, Domestic Disruptors and International Disruptors. This posting deals with the outlook for American income and wages. The entire 60-Page Jobenomics 2018 U.S. Economic Outlook report can be downloaded free from the Jobenomics Library.
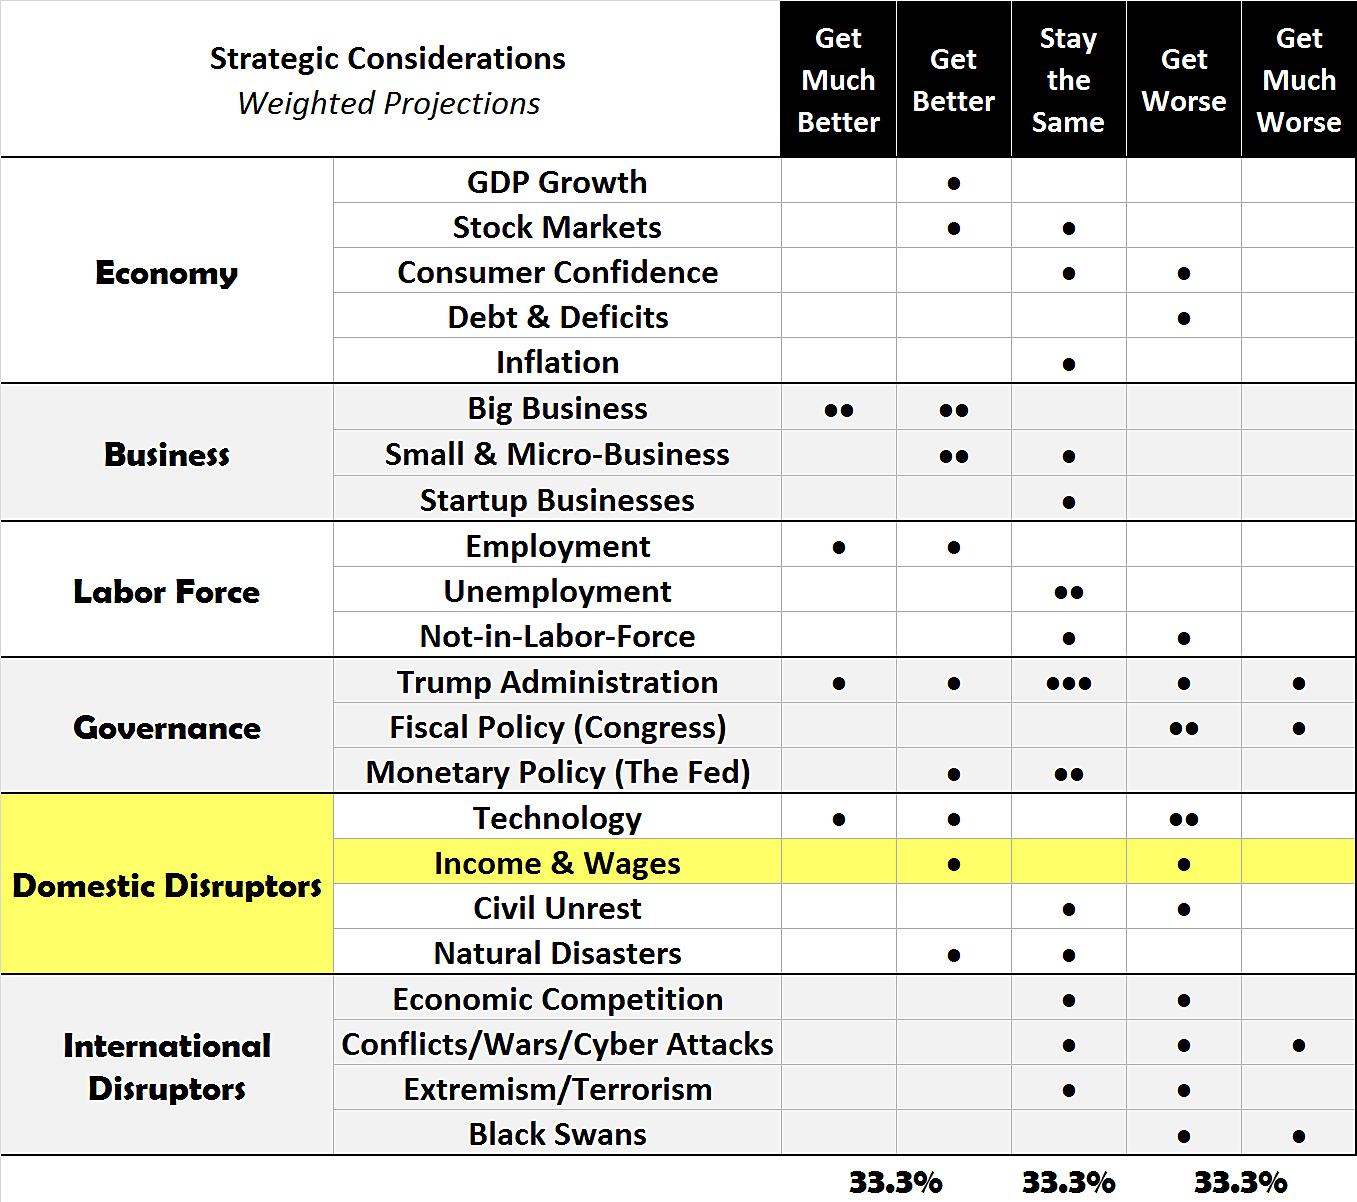
Jobenomics 2018 U.S. Economic Outlook Matrix
While wages increased somewhat since 2016, income inequality also increased. Wages are rising briskly for the top 28% who make much more than the other 72% of American wage earners who make below, usually well below, average earnings. Jobenomics foresees income inequality widening in 2018 with high-skilled workers reaping even better wages and lower-skilled workers losing ground.
Real Median Household Income by Race and Ethnicity: 1967 to 2016
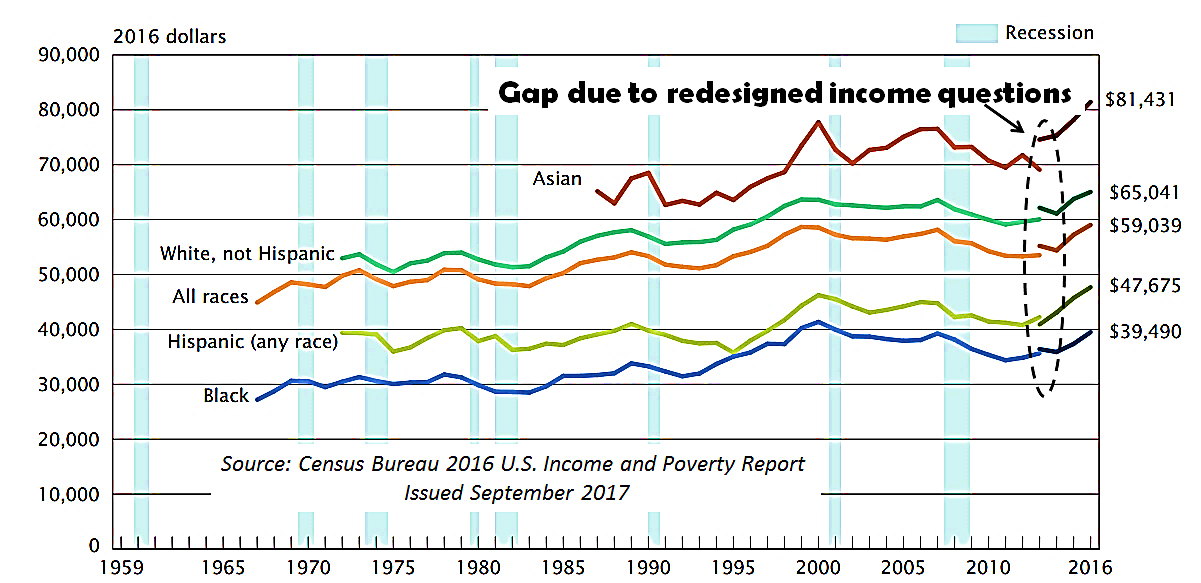
The good news since 2014, according to the September 2017 U.S. Census Bureau’s 2016 Income and Poverty report, median U.S. household income rose by 8.5% in real terms, as shown. The most impressive percentage upturns happened in minority households. Asian Americas are more prosperous than other races and ethnicities with median household income of $81,431 compared to Whites at $65,041, Hispanics at $47,675 and Blacks at $39,490. The bad news is that the lines are not converging between races and ethnicities.
Several factors contribute to the sharp 8.5% household income rise in 2015 and 2016. Firstly, in 2014, the Census Bureau redesigned their income survey questions caused the gap circled on the chart. For the most part, the 5.2% income jump in 2015 was due to how the value of assets was calculated as opposed to a real income rise. Secondly, there is ample evidence that household members are now working more hours and supplementing their incomes with two jobs or part-time work to make ends meet.
Money metrics used by economists include earnings, income and household income. It is essential to use these metrics correctly when presenting a point of view or responding to a debate. According to the BLS, Earnings include wages or salaries, net income (gross receipts minus expenses) from pay, commissions, tips, and cash bonuses. Income includes earnings, interest payments, dividends, welfare payments, rental income, child support, alimony, tax rebates, inheritance, capital gains, and appreciation of assets. Household income is the sum of all people (related or otherwise) 15 years and older living in the household.
It is also important to differentiate mean earnings from median earnings. Mean earnings is the amount obtained by dividing total labor force earnings by the number of American workers. Median divides total earnings into two equal parts: one-half of the cases fall below the median and one-half of the cases exceed the median.
While median household incomes have improved somewhat since the Great Recession, median individual earnings remained stagnant—rising an average of 1.8% per year. Mean earnings rose 2.4% over the same timeframe. The reason that mean earnings (2.4% per year) rose faster over the decade than median earnings (1.8% per year) is primarily due to the explosive growth of wages at the high end of the wage scale.
2016 U.S. Labor Force Income Earnings
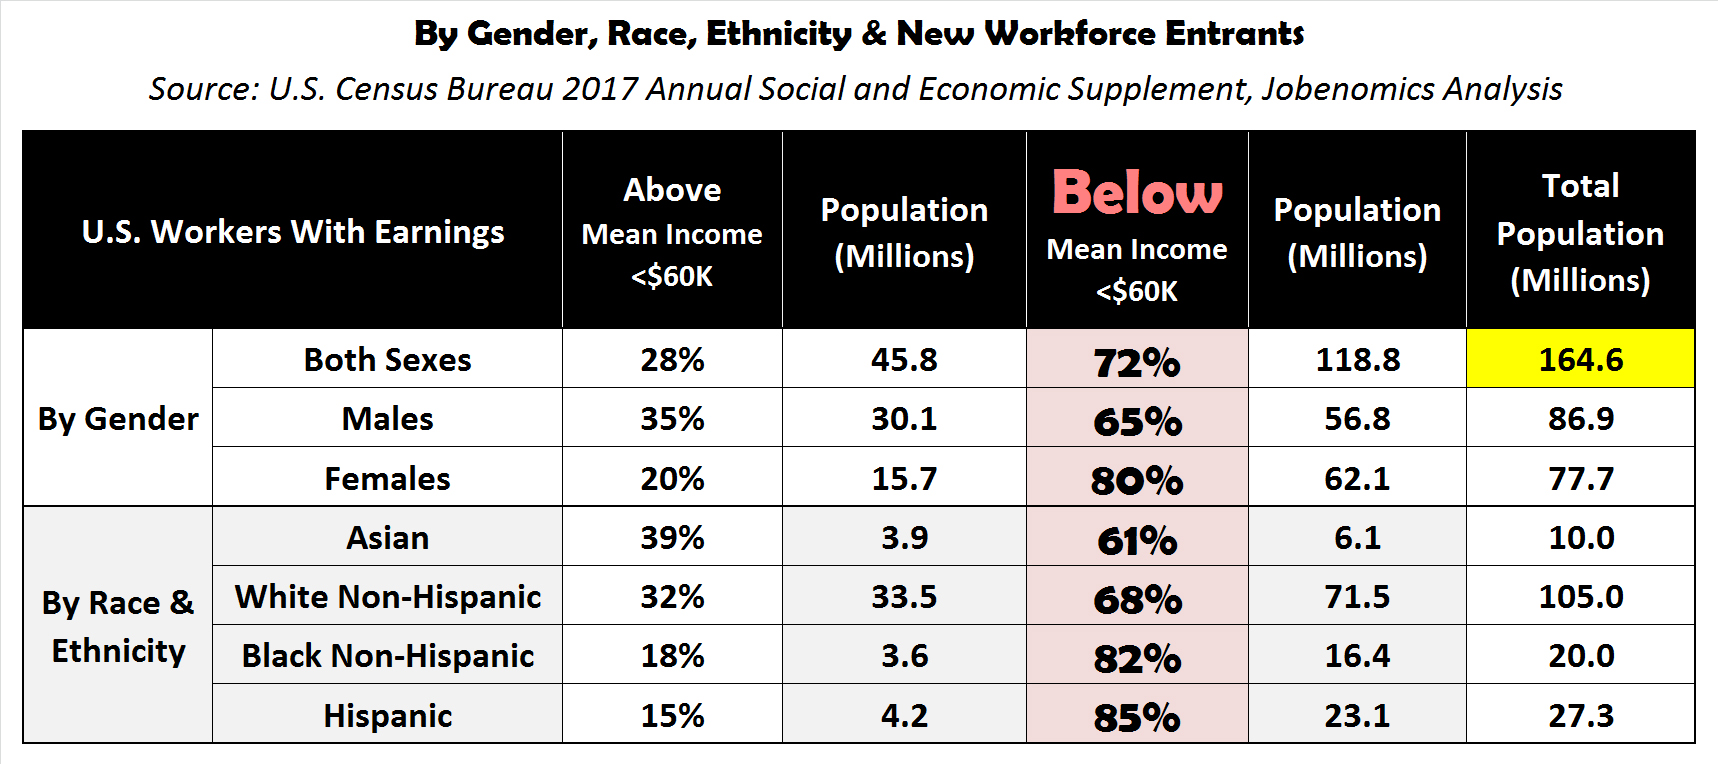
To some degree, income inequality is color blind to all sexes, races and ethnic groups. According to the 2017 Census Bureau’s Annual Social and Economic Supplement data, U.S. mean (average) earnings were $59,817 ($60K) for Americans who worked at full-time jobs in 2016. Out of a total of 164.4 million American workers 15-years old and over with earnings, 72% (118.8 million) earned below the mean. Regarding gender, 80% of American female wage earners made below average salaries compared to 65% of their male counterparts. By race and ethnicity, 85% of Hispanics made below average, followed Blacks at 82%, Whites at 68% and Asians at 61%.
Without question, the gender pay gap will be highly-charged political and social issues in 2018. According to the Census Bureau, average earnings for men was $71,916 and women $53,372, a difference of $18,554. In other words, women make only 74.2% of their male counterparts.
PayScale, a leading U.S. online compensation information company, estimates that women earn 23.7% less or 76.3% for every dollar earned by men across all jobs in the United States. However, PayScale data also indicates that American women were paid only 2.4% less or 98 cents on every dollar, than men in similar jobs. In many instances, the difference between 76 and 98 cents on the dollar is because females pursue more lower-paying positions than men. Sadly, this consideration does not fit the narrative of gender pay gap activists.
While it is true that American men make more than women, the difference is narrowing. According to the U.S. Census Bureau’s 2016 Income and Poverty report, women are closing the gap between the sexes over the last six decades.
Female-to-Male Earnings Ratio and Median Earnings of Full-Time,
Year-Round Workers 15 Years and Older by Sex: 1960 to 2016
Source: U.S. Census Bureau, Income, and Poverty in the United States: 2016126F
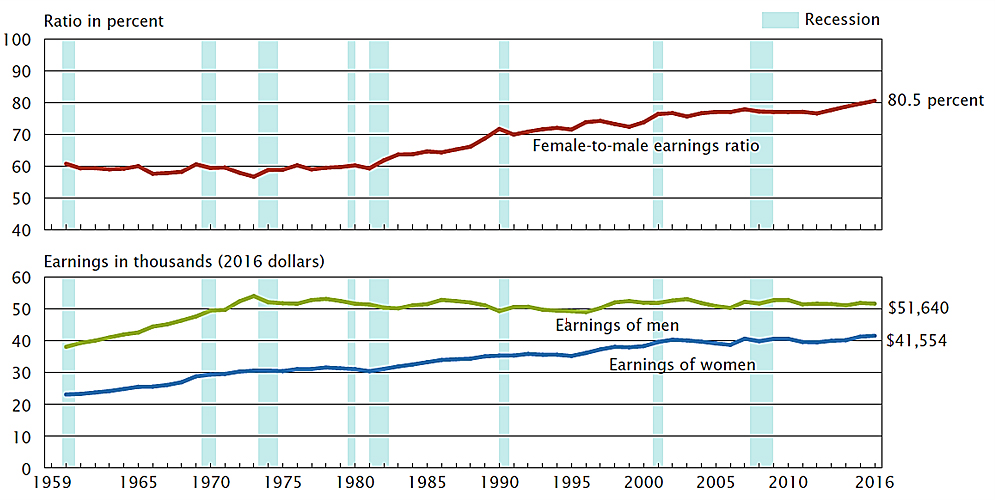
As shown, since 1960, American females narrowed the female-to-male earnings ratio gap from 60% in 1960 to 80.5% in 2016 based on real median earnings of men ($51,640) and women ($41,554) who worked full-time 50 weeks or more. Equally noteworthy, Earnings of Men has not increased since the early 1970s, whereas Earnings of Women are up 70% since 1960.
Median versus Mean Earnings by Sex in 2016
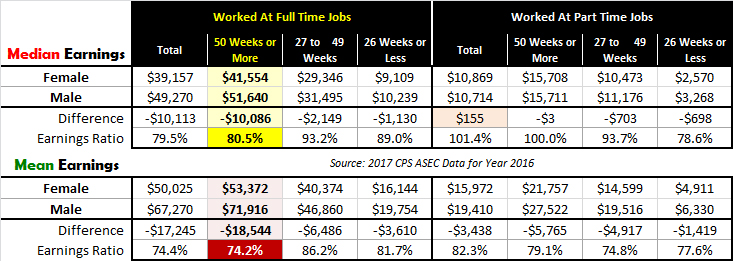
This chart shows in greater detail the differences between American males and females who received earnings in 2016. Except for Total Part-Time Jobs (highlighted in orange), women made less than their males counterparts in all categories shown. However, median (middle, highlighted in yellow) earnings of men ($51,640) and women ($41,554) were significantly less than the mean (average, highlighted in red) earnings of men ($71,916) and women ($53,372). Median earnings data for people who worked at yearly full-time jobs equated to 80.5% female-to-male earnings ratio, compared to a mean earnings ratio of 74.2%.
Median household income is the single most widely used measure of income by the Census Bureau. The Bureau prefers the use of medians as a central measure since they are less susceptible to being skewed by a small number of very high wage earners. Jobenomics prefers means over medians since top wage earner skews are essential to the gender pay gap debate. 74 cents on the dollar is a more poignant activist debate point than 81 cents on the dollar.
Examples of Skewed Distribution Curves
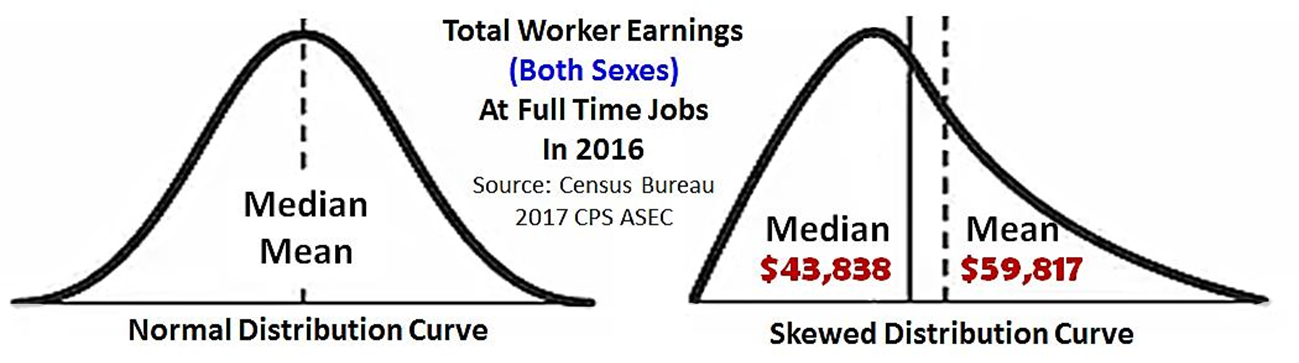
In a normal distribution curve, median and mean are the same. When the distribution curve is skewed to the left due to the preponderance of low wage earners, the median is lower than the mean. In 2016, the median income was much lower ($43,838) than mean income ($59,817), which shows the severity of skewing and why Jobenomics prefers to use the mean in comparing the gender and minority pay gaps. If economists want to show the effect of extraordinary high wages at uppermost parts of the pay scale (i.e., the Top 1%), then they should consider using the mean rather than the median.
In 2018, racial income inequality will remain an inflammatory front page issue. Rich white males are the demographic subject to the most scorn. The notion that white men make more money than non-whites is more of a red herring than factual. Percentage-wise, white men earn more than black and Hispanic men. The fact that Asian men are the most well-off financially escapes media coverage. Numbers-wise, white males are poorer than minority American males. According to Census Bureau Supplement data, there are 58,210,000 white males who earn less than mean income compared to 35,770,000 minority males (18,045,000 Hispanic males, 12,957,000 black males, and 4,768,000 Asian males).
Even though the subject of white male poverty is politically incorrect in today’s America, angry white male issues need much more attention in 2018. Having 58 million financially distressed, frustrated and well-armed white men is a potential powder keg. If a small percentage of 13 million angry black men can disrupt the social and economic order in St. Louis and Baltimore by their violent protests, one can only imagine the disruption caused by unhappy whites who outnumber their black counterparts by a factor of almost 4.5 to 1. The United States is already experiencing an upturn in white male militancy and vigilantism (as evidenced by the rise of white supremacy movements). White nationalism is likely to increase as America transitions from a white-majority to a minority-majority nation.
2011 marked the first year in U.S. history that minority births exceeded white births. In 2015, over 50% of all U.S. children aged five years old were minorities. By 2020, more than 50% of all U.S. children are expected to be part of a minority race or ethnic group. By 2044, America will be a minority-majority nation. California, Texas, New Mexico and Hawaii are already minority-majority states—not counting the upsurge in the multiracial population.
A Good Reason To Be Discouraged, Frustrated Or Angry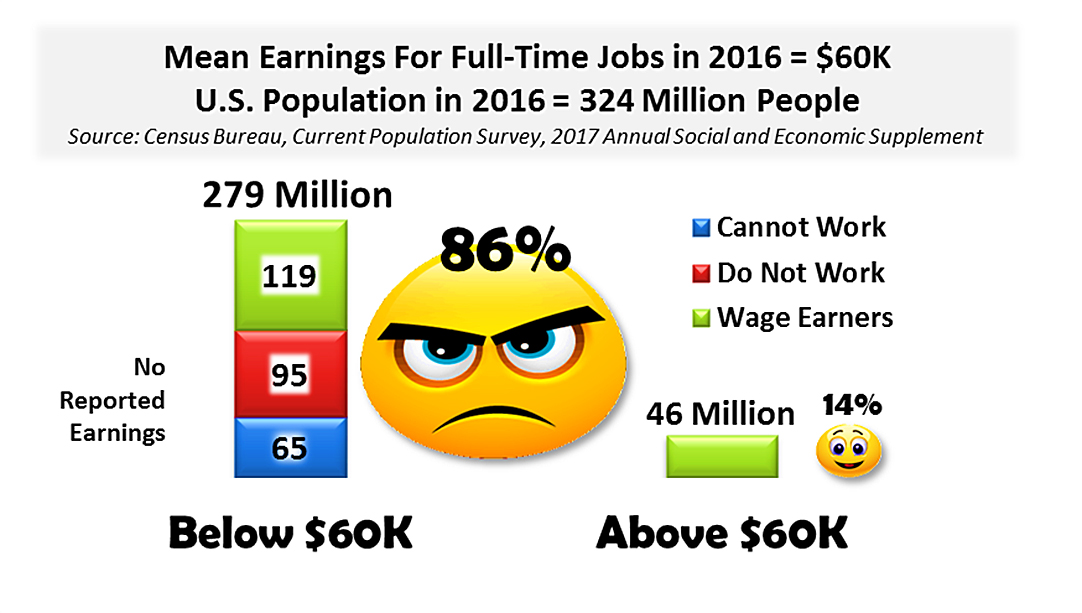 In addition to people that took a wage, the Census Bureau reports that 94.6 million citizens who were capable of working but did not work (the BLS Not-in-Labor-Force category) reported no ($0) earnings. The Census Bureau also records population figures. In 2016, the total U.S. population was 324 million people, which leaves 65 million other Americans (children, disabled, stay at home spouses, etc.) who cannot work and thus have no earnings. Consequently, out of the total population, 86% of all Americans make below the average wage. No wonder why a high percentage of the American populace is discouraged, frustrated or angry with the well-to-do.
In conclusion, the inequities discussed above will provide ample ammunition for sloganeering and activism by marginalized citizens, social justice warriors, and the opposition party in the run-up to the 2018 midterm elections. As a consequence, hot-button gender and racial issues will divert America’s attention from growing the U.S. economy to dealing with troublesome social problems. Today’s diversity movement needs to be more inclusive and unifying as opposed to polarizing. Closing gender and racial pay gaps will help minimize today’s political divide.
For a detailed discussion and data on income inequality, see the U.S. Income, Wage and Earnings section of the Jobenomics Comprehensive U.S. Labor Force & Unemployment Report.
Standby for the next posting regarding Civil Unrest & Natural Disasters as part of the Domestic Disruptors series (Technology, Income & Wages, Civil Unrest, and Natural Disasters), or download the entire 60-Page Jobenomics 2018 U.S. Economic Outlook at the Jobenomics Library.
About Jobenomics: Jobenomics deals with the economics of business and job creation. The non-partisan Jobenomics National Grassroots Movement’s goal is to facilitate an environment that will create 20 million net new middle-class U.S. jobs within a decade. The Movement has a following of an estimated 20 million people. The Jobenomics website contains numerous books and material on how to mass-produce small business and jobs as well as valuable content on economic and industry trends. For more information see https://jobenomics.com/.

