

Executive Summary: The two primary sources for U.S. labor force data are the monthly U.S. Bureau of Labor Statistics (BLS) Employment Situation Summary, a monthly summary of all U.S. government and private sector employment, and the ADP National Employment Report, a monthly survey of employment by 400,000 U.S. private sector businesses by the ADP Research Institute in collaboration with Moody’s Analytics.
Recent U.S. Labor Force Gains and Losses (BLS Data)
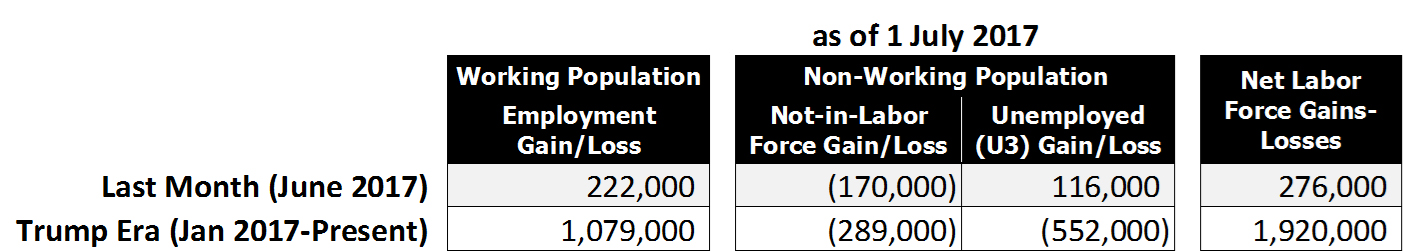
In regard to the working population, the BLS Employment Situation Summary for June 2017 reported that the United States produced a total of 222,000 new jobs—a number slightly below the 250,000 new job standard advocated by most economists.
In regard to the non-working population, the BLS reports 116,000 more people are now “officially (U3) unemployed” than the month prior, which increased the Official U3 Unemployment rate slightly from 4.3% (a post-recession low) to 4.4%. Conversely, the U.S. labor force grew by 170,000 due to fewer people being enrolled in the Not-in-Labor-Force category (a BLS category of for people who can work but choose not to work), which offset the reduction in the unemployment rolls by a net 54,000.
It is important to remember that to be recorded as unemployed one must be looking for work. If one quits looking, they are recorded as “not in the labor force” – a separate BLS category. Consequently, reducing the non-in-the-labor-force rolls while simultaneously reducing the unemployment rolls is something extraordinary positive in recent labor force history. Normally, the Not-in-Labor-Force category grows as discouraged workers quit looking for work and are de-enrolled from the Unemployment category.
While June’s employment situation showed a slight net labor force gain of 276,000, overall labor force performance for the first 6-months (January through June 2017) reflected a positive start for the Trump Administration with net gain of 1,920,000 workers to the U.S. labor force. Moreover, net gain of 1,597,000 workers in the first 6-months of the Trump Administration compares very favorably with the Obama Administration’s 8-year net labor force loss of 486,000 and the GW Bush Administration’s 8-year net loss of 2,125,000. It is important to note that the Obama and Bush Administration’s labor forces were ravaged by recession(s).
The ADP National Employment Report summary reported that the U.S. private sector created 158,000 new jobs of which 68.4% were generated by American small businesses. Note: The 222,000 new jobs reported by the BLS include 187,000 new private sector jobs and 35,000 new government workers. ADP does not report on unemployment or workforce departures.
Data Analysis and Discussion. To get a strategic perspective of the state of the U.S. labor force and workforce issues facing the United States, one must compare the Working Population (Employed) against the Non-Working Population (U3 Unemployed and Not-in-Labor-Force).
Working Versus Non-Working Populations
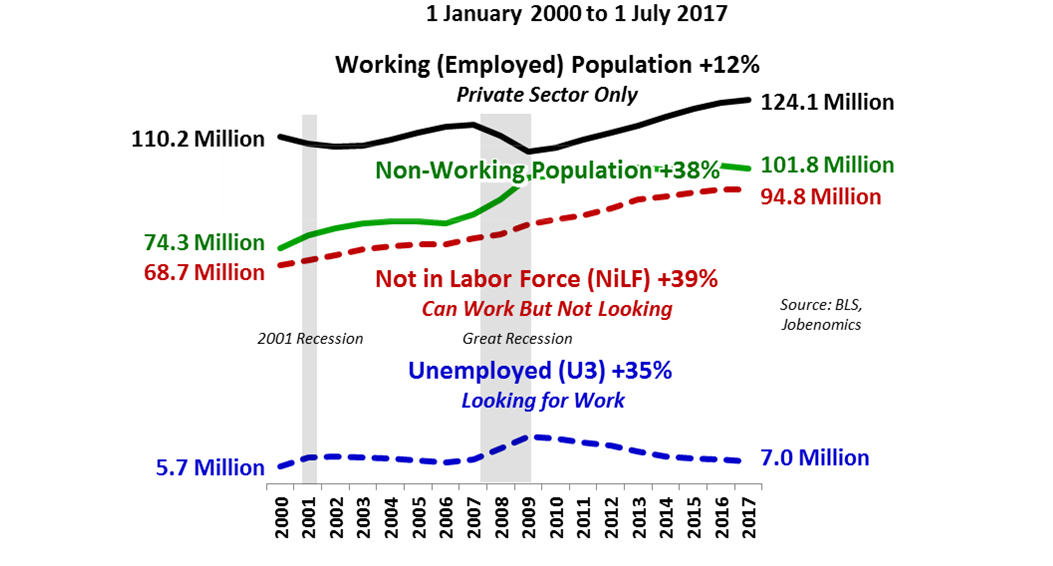
As shown, from 1 January 2000 to 1 July 2017, the private sector’s Working (Employed) population rose by 12% compared to the private sector’s Non-Working Population rise of 38%. Jobenomics defines the Non-Working Population as Not-in-Labor Force (that rose by 39%) and the Officially U3 Unemployed (which is still 35% higher today than in year 2000 in terms of numbers of unemployed).
President Trump’s vision of a “dynamic and booming economy” ultimately depends on mass-producing business, especially small business, creation in order to generate tens of millions of million net new jobs and substantial GDP growth over the next decade. Most economists believe that economic growth depends on employment and GDP growth. The ideal rate for U.S. GDP growth is around 3%. Any GDP growth below 2% is considered sclerotic growth that makes the U.S. economy vulnerable to financial downturns.
Real GDP Quarterly Percent Change This Decade
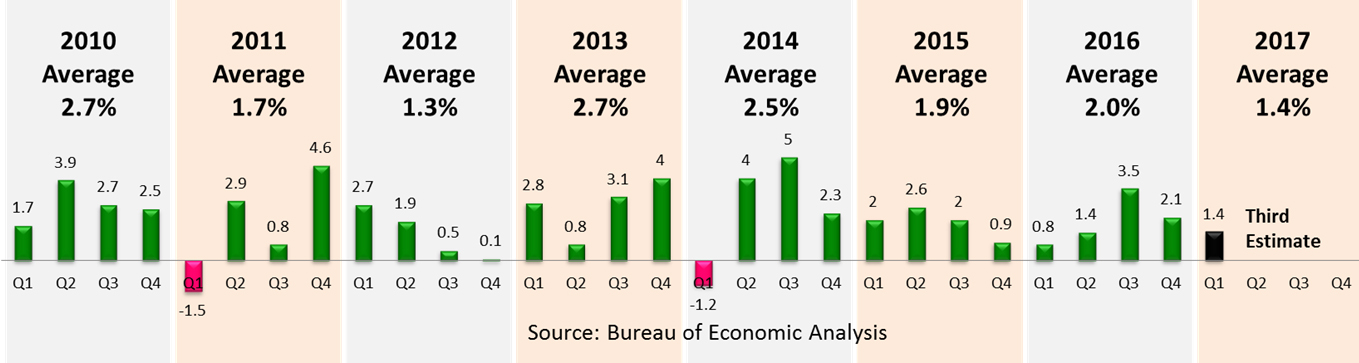
According to the Bureau of Economic Analysis (BEA), during the post-recession recovery period from Q1 2010 through Q2 2017, U.S. GDP averaged 2.1%. In 2015 and 2016, U.S. GDP grew by sub-par rates of 1.9% and 2.0%. Q1 2017’s GDP projection (third estimate) was an abysmal 1.4% (up from the 0.7% initial estimate and the 1.2% second estimate. It appears that the final BEA Q1 2017 GDP will be significantly below President Trump’s bold plan “to return to 4% annual economic growth.” Hopefully, Q2 2017’s GDP growth rate will be much more robust.
The Federal Reserve Bank of Atlanta’s GDPNow forecasting model for Q2 2017 was initially 4.3% on 1 May 2017 but subsequently downgraded to 2.7% as of 6 July 2017. It is important to note the Fed’s GDPNow forecasting model for the Q1 2017 initial forecast was 3.1% on 2 February 2017 and continually decreased to 0.2% by the end of the reporting period. As annotated by the Atlanta Fed, the “Blue Chip Economic Indicators” survey of a range of Top 10 and Bottom 10 forecasts by leading business economists project Q2 2017 growth at 2.8%.
While GDP growth does not insure employment growth, sclerotic GDP growth discourages business hiring, consumer spending and labor force expansion. Sclerotic GDP growth also discourages lower rates of unemployment and voluntary workforce departures. Negative GDP growth creates recessions and depressions depending on the severity and longevity of the contracting economy.
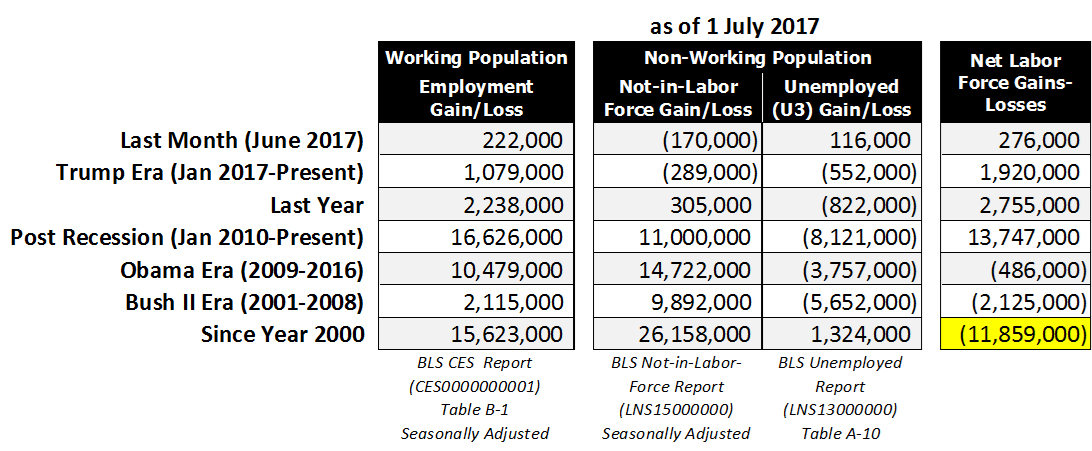
The period of sclerotic GDP growth from 2000, has dramatically impacted the American middle-class and the U.S. labor force that this is weaker by 11,859,000 workers today (highlighted in yellow below) than at the beginning of the 21st Century. This weakness is further exacerbated by population growth of 45 million people since year 2000. For most American workers, real wages (purchasing power) have not increased for decades and are not projected to improve anytime soon. America’s aggregate household income has shifted from middle-income to upper-income households, causing many middle-class workers to leave the workforce altogether. The solution to avoid a financial crisis is to accelerate GDP growth, which requires the creation of more productive private sector jobs, which, in turn, can only be generated by a massive expansion of the small business sector.
Historical Perspective of U.S. Labor Force Gains and Losses Since 2000
The Bureau of Labor Statistics (BLS) Employment Situation Summary reported that last month (June 2017), 222,000 Americans entered the U.S. labor force, a 170,000 less Americans were recorded in the BLS’ “Not-in-Labor-Force” category (a category reserved for Americans who can work but choose not to work), and 116,000 more citizens were categorized as officially unemployed, for a net workforce gain of 276,000 Americans—a relatively positive report.
From a Trump Era perspective, during the 6-months (January through June 2017) of the Trump presidency, labor force gains amounted to 1,079,000 workers, for an average of 180,000 per month, which is below the threshold of 250,000 jobs per month that most economists believe is necessary for healthy economic growth. However, the Not-in-Labor-Force (i.e., capable of working but not looking) and U3 Unemployment (i.e., no job but looking for work) categories have shown significant reductions, 289,000 and 552,000 respectively. Apparently, the new Administration is giving people a reason to rejoin the workforce. Moreover, the net gain of 1,920,000 workers in the first 6-months of the Trump Administration compares very favorably with the Obama Administration’s 8-year labor force net loss of 486,000 workers and the GW Bush Administration’s net loss of 2,125,000 as shown.
Since the end of the Great Recession, from 1 January 2010 to 1 July 2017, the U.S. labor force net gain was 13,747,000 workers. 16,626,000 entered the labor force, 11,000,000 voluntarily departed, and 8,121,000 fewer people were officially unemployed.
During the 8-years/96-months of the Obama Era (1 January 2009 through 31 December 2016), the U.S. labor force lost a net 486,000 jobs. 10,479,000 entered the labor force, 14,722,000 voluntarily departed, and 3,757,000 fewer people were recorded as officially unemployed. It is important to remember that President Obama took office during the last 6-months of Great Recession.
During the 8-years/96-months of the GW Bush Era (1 January 2001 through 31 December 2008), the U.S. labor force lost a net 2,125,000 jobs, which included the first 12-months of Great Recession, the 8-months of the 2001 Recession (March 2001–November 2001), as well as the aftermath of the September 11, 2001 attacks. 2,115,000 entered the labor force, 9,892,000 voluntarily departed, and 5,652,000 fewer people were recorded as officially unemployed.
From the beginning of 21st Century (1 January 2000 to 1 July 2017), the American labor force is weaker by a net 11,859,000 workers.
As of 1 July 2017, the BLS reports that the private sector workforce consists of 124,051,000 workers or only 38% of the total population of 325 million. Of the private sector workforce, approximately 60% are traditional full-time workers and 40% are contingent workers (part-timers, freelancers, independent contractors, etc.) who generally-speaking earn far less income than traditional workers and often receive little or no benefits. The U.S. economy cannot be sustained without strengthening of the U.S. private sector’s labor force.
ADP National Employment Report Data and Discussion. The June 2017 ADP National Employment Report, released on 6 July 2017, reported 158,000 private sector new jobs, which is an insufficient number of jobs to grow the economy.
U.S. Private Sector Employment by Company Size

As reported by the ADP National Employment Report, small businesses are undeniably the dominant employer and job creator in the United States. According to ADP, small businesses with less than 500 employees employ 77.3% of all private sector Americans with a total of 96,040,000 employees—over 3.4-times the amount of large businesses with more than 500 employees that have 28,275,000 employees. Micro and self-employed businesses with 1-19 employees employ 1.6-times the number of major corporations with over 1,000 employees (31,229,000 versus 19,803,000).
U.S. Private Sector Jobs Created This Decade by Company Size
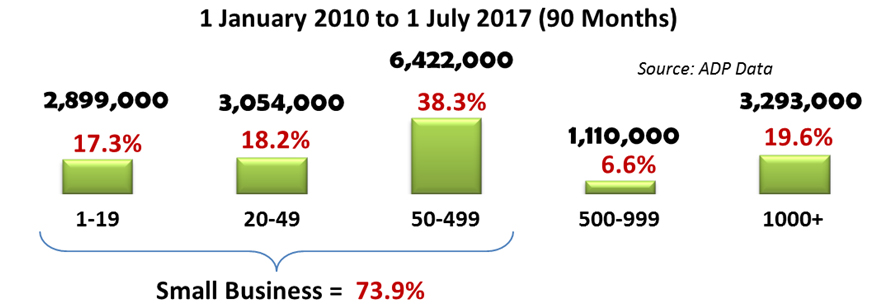
Since the beginning of this decade, small businesses created 73.9% of all new jobs in the United States. Small businesses with less than 500 employees created 2.8-times more jobs as large businesses with over 500 employees, or 12,375,000 versus 4,403,000 new jobs respectively. Micro and self-employed businesses with 1-19 employees created 0.9-times (90%) the number of major corporations with over 1,000 employees (2,899,000 versus 3,293,000).
U.S. Private Sector Jobs Created Last Month by Company Size
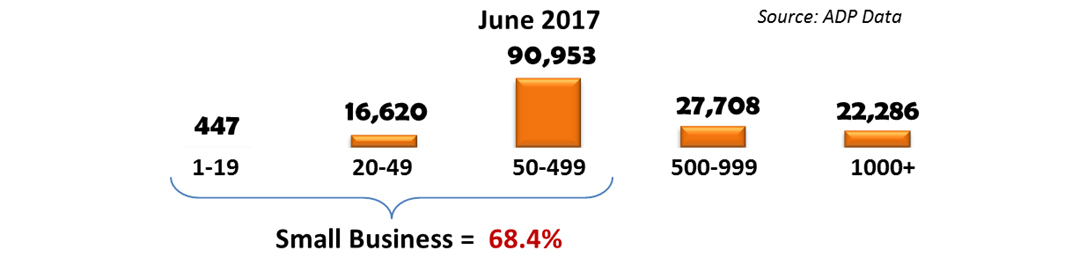
Last month (June 2017), U.S. small business created 68.4% (down from 77.2% in May, 72.2% in April and 81.9% in March) of all new U.S. jobs. Microbusiness (1-19 employees) job creation of 447 jobs is the second lowest number in 3.5 years. Notwithstanding poor microbusiness performance, medium-sized small businesses (50-499 employees) outperformed all other sectors combined. While most of the America’s and the world’s attention is focused on the Trump Administration’s big business focus (e.g., reshoring jobs and trade policies), it is small business that produced 108,019 (68.4%) out of the 158,013 new private sector jobs last month, whereas, despite all the political rhetoric and media attention, big business (500+ employees) created only 49,994 new jobs.
Concluding Thoughts. According the nonpartisan Congressional Budget Office’s 2017 to 2027 Budget and Economic Outlook report, “over the next five years, the monthly increase in nonfarm payroll employment, which is estimated to average 160,000 jobs in the first half of 2017, is projected to settle down to an average of 64,000 jobs.” If the CBO outlook is correct, the next decade is likely to produce only 9 million jobs, which is far short of President Trump’s projection of 25 million new jobs. Note: last year’s BLS Employment Projections: 2014-24 Summary report forecasts that the United States will produce only 9.9 million new jobs over the next decade.
Jobenomics tends to agree with the CBO and BLS for the reasons discussed in the Jobenomics 20-part series entitled President Trump’s New Economy Challenge. However, the Trump Plan can be amended to ameliorate CBO and BLS projected shortfalls. With proper leadership, the Administration can lift tens of millions of Americans out of poverty by making the following four structural changes to President Trump’s economic and job creation plan:
- Balancing the traditional standard industrial economy with the newly emerging nonstandard digital economy,
- Mitigating the mass-exodus of able-bodied workers who are voluntarily departing the U.S. labor force for lives of dependency and alternative (often illicit) lifestyles,
- Addressing the challenge of the ever-growing contingency workforce that will soon be the dominate form of labor in the United States, and
- Mass-producing small and self-employed businesses—the engine of the U.S. economy—and the employer of the vast majority of Americans.
If the Trump Administration can achieve a sustainable 4% GDP in a stable global economy, Americans and the world will be euphoric. This feat will not be easy. The last year the United States breached 4% in a single year was 2001. The last time that the United State reached 4% over ten consecutive years over the last 50-years was never (3.5% was the highest from 1976 to 1985). If the Trump Administration can tie the 3.5% record over the next decade, they will be vindicated and worthy of much praise.
About Jobenomics: Jobenomics deals with economics of business and job creation. The non-partisan Jobenomics National Grassroots Movement’s goal is to facilitate an environment that will create 20 million net new middle-class U.S. jobs within a decade. The Movement has a following of an estimated 20 million people. The Jobenomics website contains numerous books and material on how to mass-produce small business and jobs.

