
Executive Summary. The Trump Administration’s bold economic and job creation vision (i.e., sustained 4% GDP growth and 25 million new jobs) is facing stiff headwinds from the opposition, Washington and even the weather (Hurricanes). This vision is likely to fall short unless the Trump Administration places as much attention on small and micro-business creation and sustainment as it does on big business. As addressed in this analysis, recent employment and economic reports present a mixed picture on President Trump’s progress during his first 9-months in office. After 83-months of consecutive employment gains, the United States failed to produce any new jobs (a loss of 33,000 jobs). To a large extent, this lost can be attributed to the impact of three major hurricanes. On a brighter note, GDP rose to 3.1%, the unemployment rate dropped to a post-recession low of 4.2% freeing 331,000 Americans from the bondage of unemployment, and the number of sidelined citizens categorized as “not-in-the-labor-force” decreased by 368,000 people. Download this 14-page report at Jobenomics Employment & GDP Report, 9 October 2017.
Jobs Gains/Losses Since 2001
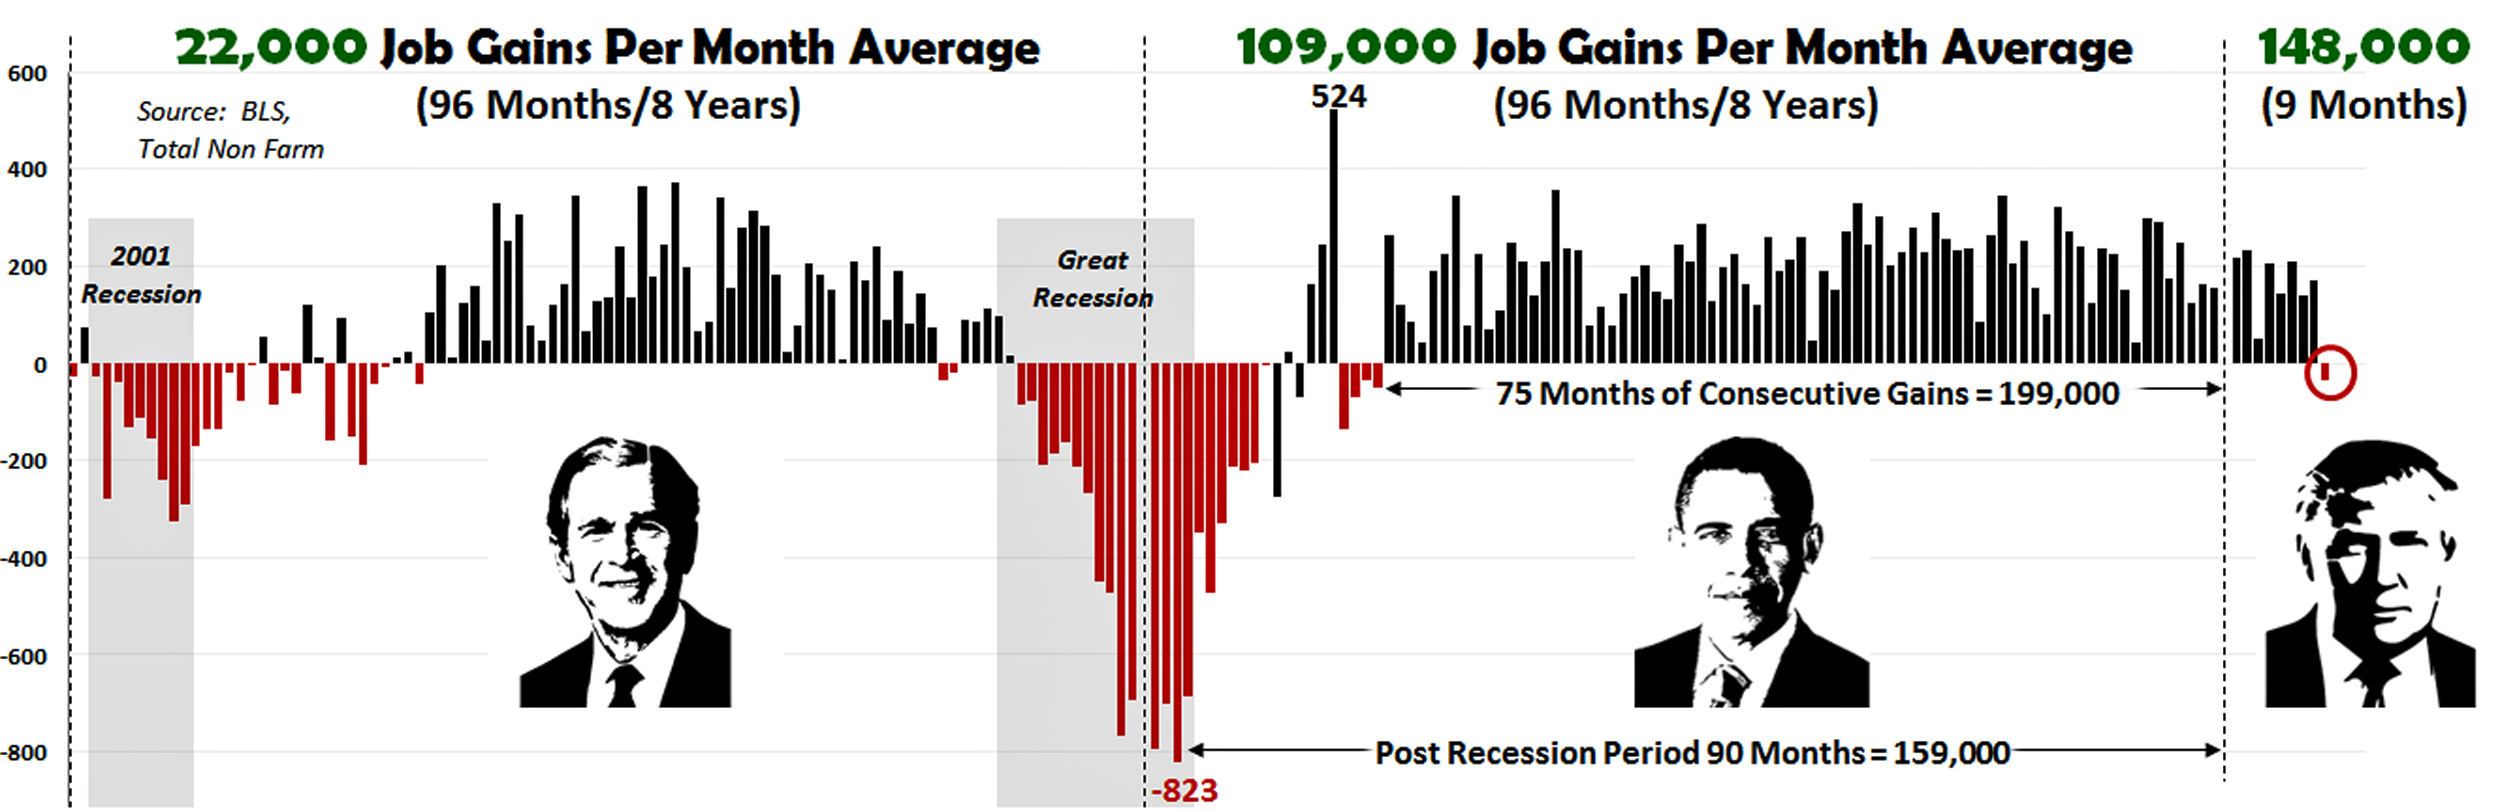
The question that policy-makers, pundits and the general public really want to know is how does the latest job creation number compare to past history? As shown, since 2001, the job creation high water mark of 524,000 monthly new jobs was achieved in May 2010, and the low water mark for jobs losses was 823,000 in March 2009. The average monthly number of new jobs from January 2001 to October 2017 was a measly 63,000 job gains per month (not shown) that adversely impacted the U.S. economy and hollowed out the American middle class. From an Administration standpoint,
- The Bush Administration (2001 to 2008) created an average of only 22,000 new jobs per month, due to the onslaught of two major recessions, the calamity of 9/11 and the United States’ expensive mobilization for the global war on terrorism.
- The Obama Administration (2009 to 2016) created an average 109,000 job gains per month. If the six months of the Great Recession that Obama “inherited” was subtracted, the average of the ensuing 90-month period yielded an average of 159,000 new jobs per month. Perhaps, the greatest legacy of the Obama Administration is 75-months of consecutive job gains (the longest run since WWII) averaging 199,000 jobs per month during a period where the U.S. economy grew at a sclerotic rate of only 1.5%.
- The Trump Administration continued the positive job creation trend with 8 consecutive months of job gains until last month, which ended the 83-month run of job gains with a loss of 33,000 jobs that was precipitated by the devastation caused by three major hurricanes. To date, the Trump Administration is averaging 148,000 job gains per month, which hopefully is only a speed-bump in President Trump’s efforts to create 25 million new jobs over the next decade. Jobenomics considers these job losses as a “speed-bump” since the overall economy (GDP) is slowly improving, recovery operations will recoup many of the hurricane-related job losses, and more sidelined and unemployed people are now looking for work. In addition, if Washington revamps the tax code as promised, businesses will be motivated to reinvest in America and hire more American workers.
To achieve his 25 million goal, the Trump Administration would need to create 213,000 new jobs per month over the next 9 ¼ years. To compensate for good and bad months, 250,000 jobs per month is a reasonable goal that is accepted by most economists as the standard to sustain robust economic growth. During the 83-month run of job gains, the 250,000 job gain standard was exceeded 19-times, or nearly one out of every four months. So, increasing the job creation threshold to 250,000 is an achievable goal, especially if more attention is proffered to small business creation.
From a Jobenomics standpoint, job gain/loss statistics are important, but they are only a prelude to a much more important question regarding net labor force gains and losses. As will be discussed in detail in this report, the U.S. labor force consists of 255,562,000 citizens (called the civilian noninstitutional population) who are working citizens, the unemployed who are looking for work, and people who can work but choose not work for a multiplicity of reasons. When the totality of the civilian noninstitutional population is considered, September’s job losses are not as bad as it seems due to the fact that 699,000 unemployed and Not-in-Labor-Force (can work but not working) citizens rejoined workforce mitigated the sting of the 33,000 job losses.
To fully understand net labor force gains and losses, Jobenomics uses two primary sources of U.S. labor force data: (1) the monthly U.S. Bureau of Labor Statistics (BLS) Employment Situation Summary, a monthly summary of all U.S. government and private sector employment, and (2) the ADP National Employment Report, a monthly survey of employment by 400,000 U.S. private sector businesses by the ADP Research Institute in collaboration with Moody’s Analytics.
Jobenomics Analysis of the BLS Employment Situation Summary Report.
On 6 October 2017, the BLS reported that September’s total nonfarm payroll employment decreased by 33,000, which is the first loss of jobs after 83-months of consecutive labor force gains—the longest span of labor force gains since BLS record keeping began in February 1939. On the positive side of the ledger, BLS reported that the U3 unemployment rate dropped to a post-recession low of 4.2% freeing 331,000 Americans from the bondage of unemployment, and 368,000 sidelined citizens, categorized as “not-in-the-labor-force”, began looking for work or reentered the U.S. labor force. Overall, the BLS report was a mixed picture for the American public and Trump Administration since the U.S. labor force has not yet kicked into high gear.
The September BLS report included only some of the severe economic and workforce impacts of Hurricanes Harvey, Irma, and Maria (and to a minimum degree Hurricane Nate). The economic impact of these storms is estimated in to be as high as $300 billion due property damage, lost output, insurance claims and federal aid. The brunt of economic shock will be felt in Q3 and Q4 GDP reports. A wide range of economics estimate that quarterly GDP will decrease between 20% and 30%. Labor force shocks are also likely to be recorded in subsequent employment reports. Hurricane Katrina sidelined an estimated 800,000 employees and Hurricane Sandy sidelined 400,000 workers and caused many small businesses to close. The economic impact of Harvey, Irma and Maria are likely to be more onerous than Katrina and Sandy.
- Total employment of Houston, South Western Florida and Puerto Rico is approximately 7 million workers. While there are no official assessments of sidelined workers in these afflicted areas, it reasonable to estimate that several million workers were, and will continue to be, sidelined. Almost the entire workforce of 1 million Puerto Ricans were paralyzed due to power outages and destruction of much of the island’s aging infrastructure. Moody’ Analytics, a leading risk management and research firm, predicts that recovery operations from recent storms will take 6-months to recover 80% of the economy and up to 3-years to reach 100%.
- Unfortunately, the United States is still in the early phases of disaster recovery from the hurricane trifecta. Five phases of disaster recovery include search and rescue, emergency relief, early recovery, mid to long term recovery, and community development. Construction, durable goods (e.g., automotive, household appliances and home furnishings), non-durable goods (e.g., food, clothing and commodities) and professional services should be the first business sectors to rebound from the calamity due tens of billions of dollars of disaster recovery spending. However, tens of thousands of retail operations and under insured homeowners and small business are likely to remain shuttered for quite a while, or forever.
- Given the massive economic scope of these disasters, there may not be enough federal money to fund needed recovery operations let alone for community and infrastructure development for communities like Puerto Rico that is in $70 billion debt.
The September BLS report also provides a strategic perspective on the state of the U.S. labor force that underpins the entire U.S. economy.
Working Versus Non-Working Populations
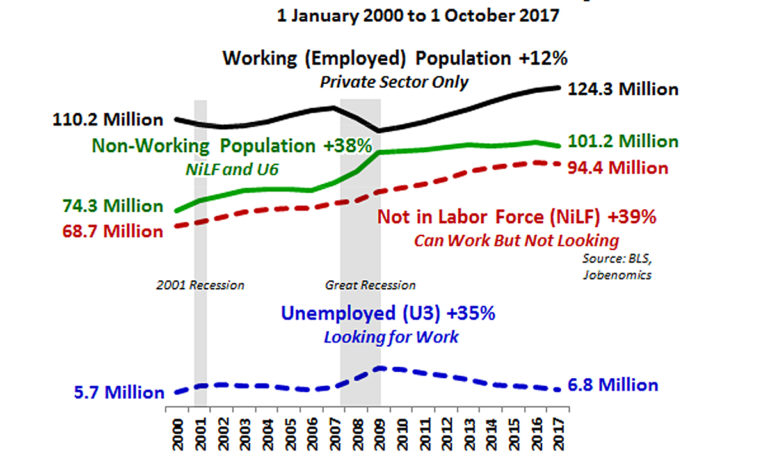
This graph presents a strategic perspective of the U.S. private sector workforce covering the time period from 1 January 2000 to 1 October 2017. The private sector produces the vast majority of goods and services that drives economic growth. Since the turn of the 21st Century, the U.S. private sector’s Working (Employed) population rose by 12% compared to a rise of 38% in the Non-Working Population. Jobenomics defines the Non-Working Population as Not-in-Labor Force (that rose by 39%) and the Officially U3 Unemployed (which is still 35% higher today than in year 2000 in terms of numbers of unemployed). It is important to notice on the above chart, that the Non-Working Population almost equaled the size of the Working Population at the end of the Great Recession. Since the Great Recession the Working Population has grown while the Non-Working Population has stabilized. The question to ponder for the future is whether employment and economic (GDP) growth can continue to grow the workforce while simultaneously reducing the Not-in-Labor cadre substantially. Unfortunately for the next fiscal quarter (or two), the impact of three major hurricanes is likely to suppress workforce gains and accelerate workforce departures.
U.S. Labor Force Gains and Losses Since 2000
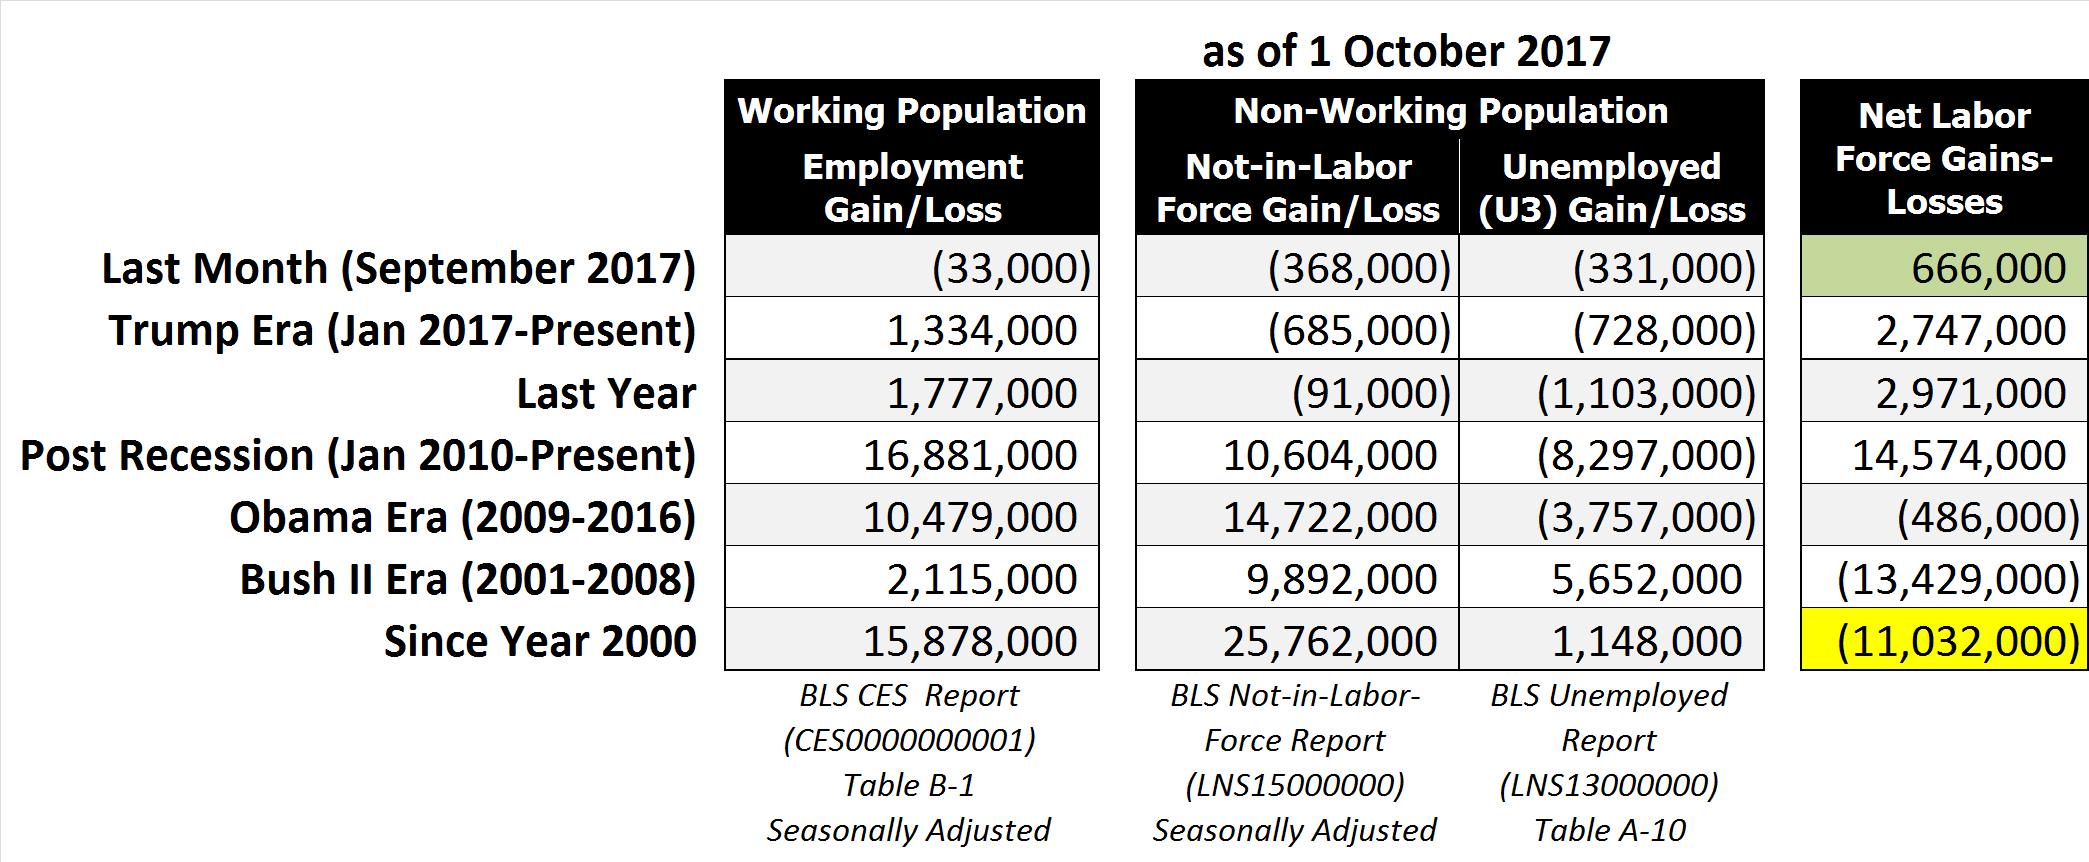
The above chart, analyzes U.S. labor force gains and losses according to time periods and presidential administrations.
In September 2017, the Working Population degraded by a total of 33,000 jobs and the Non-Working Population improved with 368,000 fewer people enrolled in the Not-in-Labor-Force (a BLS category of for people who can work but choose not to work) and 331,000 fewer unemployed citizens. The reduction in the Not-in-Labor-Force category is a positive indication that citizens sidelined from working due to frustration, welfare, retirement, education, etc., are now rejoining the workforce. The BLS also reported that the Official U3 Unemployment rate dropped from 4.4% to 4.2% a post-recession low. From a historical unemployment rate perspective, the post-WWII low was 2.5% in June 1953, followed by 3.4% in May 1969 and 3.8% in April 2000. As highlighted in green, the net labor force gain in September was 666,000, which is the silver lining in the latest BLS’ Employment Situation Summary report.
During the 9-months (January through September 2017) of the Trump Administration, Working Population gains amounted to 1,344,000 workers, for an average of a little over 148,000 per month, which is below the desired threshold of 250,000 jobs per month. However, the Not-in-Labor-Force and U3 Unemployment categories recorded positive reductions of 685,000 and 728,000 respectively. The Trump Administration net labor force gain equates to 2,747,000 over the first 9-months of President Trump’s first term in office. This 9-month net gain of 2,747,000 compares very favorably with the Obama Administration’s 8-year labor force net loss of 486,000 and the GW Bush Administration’s 8-year devastating workforce net loss of 13,429,000. However, it is too early to tell if Trump’s favorable statistics will stand up to the test of time.
Since the end of the Great Recession, from 1 January 2010 to 1 September 2017, the U.S. labor force net gain was 14,574,000 workers. 16,881,000 new workers entered the labor force. 8,297,000 workers departed unemployment rolls. Unfortunately, a corresponding number of citizens joined the ranks of the Not-in-Labor-Force that rose by 10,604,000 citizens. To the general public, pundits (mainly the Obama Administration, Democrats and media) spun this decrease of 8,297,000 unemployed personnel as a sign of a rapidly improving economy and largely ignored the fact that over 10 million citizens voluntarily departed the labor force to pursue alternative non-working lifestyles, such as welfare, education and the illicit/underground economy
During the 8-years/96-months of the Obama Era (1 January 2009 through 31 December 2016), the U.S. labor force lost a net 486,000 jobs, of whom 10,479,000 entered the labor force, 14,722,000 voluntarily departed, and 3,757,000 fewer people were recorded as officially unemployed. It is important to remember that the first 21-months of the Obama Administration, the President was immersed in Great Recession and post-recession recovery operations. Obama’s next 75-months in office produced the longest run of consecutive labor gains since WWII when BLS recording keeping began. This 75-month run greatly exceeded the previous record of 48-months that was recorded from July 1986 to June 1990.
During the 8-years/96-months of the Bush II Era (1 January 2001 through 31 December 2008), the U.S. labor force lost a net 13,429,000 jobs, which included the 8-months of the 2001 Recession (March 2001 through November 2001) and 13-months of Great Recession (December 2007 through December 2008), the aftermath of the September 11, 2001 attacks, the ensuing global war on terrorism as well as Hurricanes Katrina, Ike, Rita, Wilma, Ivan, Charley, Frances, Jeanne and Allison that collectively caused over $275 billion in damage. As a result of these constant calamities, all three labor force sectors yielded negative results: only 2,115,000 workers entered the labor force (an abysmal average of only 22,000 new jobs per month), 9,892,000 able-bodied citizens voluntarily departed, and 5,652,000 people were added to the unemployment rolls.
From the beginning of the 21st Century (1 January 2000 to 1 September 2017), the American labor force is still weaker by a net 11,032,000 workers (highlighted in yellow). This weakness is exacerbated by a population growth of 44 million additional American citizens present today compared to 2000 (282 million versus 326 million) plus the impact of a rapid rise of contingent part-time workers in comparison to traditional full-time workers.
To sum up, BLS data indicates that the U.S. economy cannot be sustained without strengthening of the U.S. private sector’s labor force. The private sector workforce consists of 124,322,000 workers or only 38% of the total population of 326 million. Of the private sector workforce, approximately 60% are traditional full-time workers and 40% are contingent workers (part-timers, freelancers, independent contractors, etc.) who generally-speaking earn far less income than traditional workers and often receive little or no benefits. To achieve economic and labor force growth, policy-makers and decision-leaders must concentrate on small business creation and sustainment. The ADP National Employment Report provides detailed and timely small businesses information and their contribution to the U.S. labor force.
Jobenomics Analysis of the ADP National Employment Report.
The September 2017 ADP National Employment Report, released on 4 October 2017, stated that the U.S. non-farm private sector created 135,000 new jobs, which is significantly more than the 33,000 losses reported by the BLS. Note: the 33,000 losses reported by the BLS consist of 40,000 non-farm private sector jobs lost and 7,000 government new employees. ADP does not report on government employment, unemployment or workforce departures as does the BLS.
Of the 135,000 U.S. non-farm private sector new jobs, small businesses (1-49 employees) lost 7,000 jobs, midsized businesses (50-499 employees) gained 63,000 new jobs, and large businesses (500+ employees) gained 79,000 new jobs. Service-providing industries created 88,000 with Professional/Business Services and Education/Health Services being the star performers producing 51,000 and 29,000 new jobs respectively. Goods-producing industries created 48,000 jobs with Construction and Manufacturing producing 29,000 and 18,000 jobs respectively. The biggest losers were the Trade/Transportation/Utilities and Non-Internet Information sectors with losses of 18,000 and 11,000 employees.
For the purposes of this report, Jobenomics classifies small business as having 1-499 employees (the definition supported by the U.S. Small Business Administration), midsized business as 500-999 and large businesses as 1000+ employees. In addition, Jobenomics defines micro-businesses as having 1-19 employees that includes self-employed firms.
U.S. Private Sector Employment by Company Size
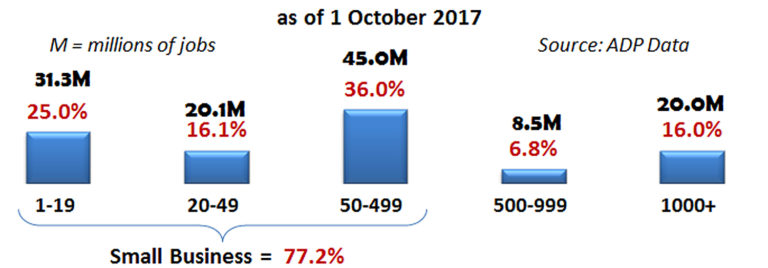
As reported by the ADP National Employment Report, small businesses are undeniably the dominant employer in the United States. According to ADP, small businesses with less than 500 employees employ 77.2% of all private sector Americans with a total of 96,372,000 employees—over 3.4-times the amount of large businesses with more than 500 employees that have 28,542,000 employees. Micro-businesses with 1-19 employees employ 1.6-times the number of major corporations with over 1,000 employees (31,288,000 versus 20,016,000).
U.S. Private Sector Jobs Created This Decade by Company Size
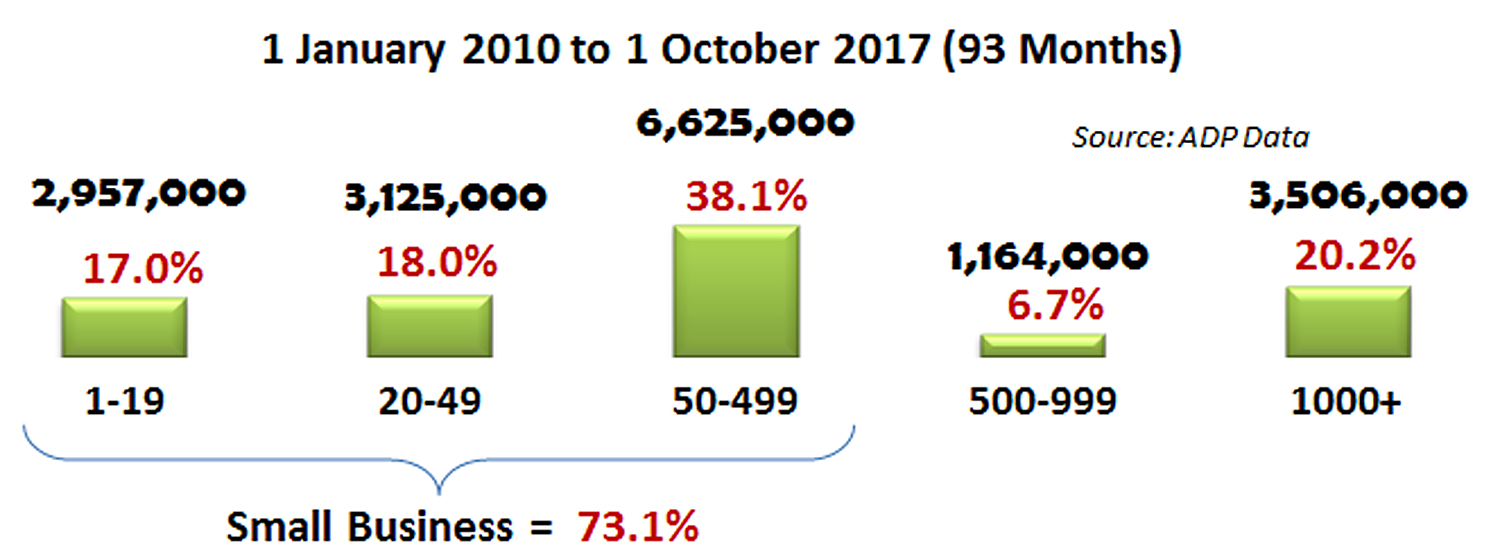
Since the beginning of this decade, small businesses created 73.1% of all new jobs in the United States. Small businesses with less than 500 employees created 2.7-times more jobs as large businesses with 500+ employees, or 4,799,000 versus 12,707,000 new jobs respectively. Micro and self-employed businesses with 1-19 employees created 0.9-times (90%) as many jobs as major corporations with over 1,000 employees (3,131,000 versus 4,670,000).
U.S. Private Sector Jobs Created Last Month by Company Size 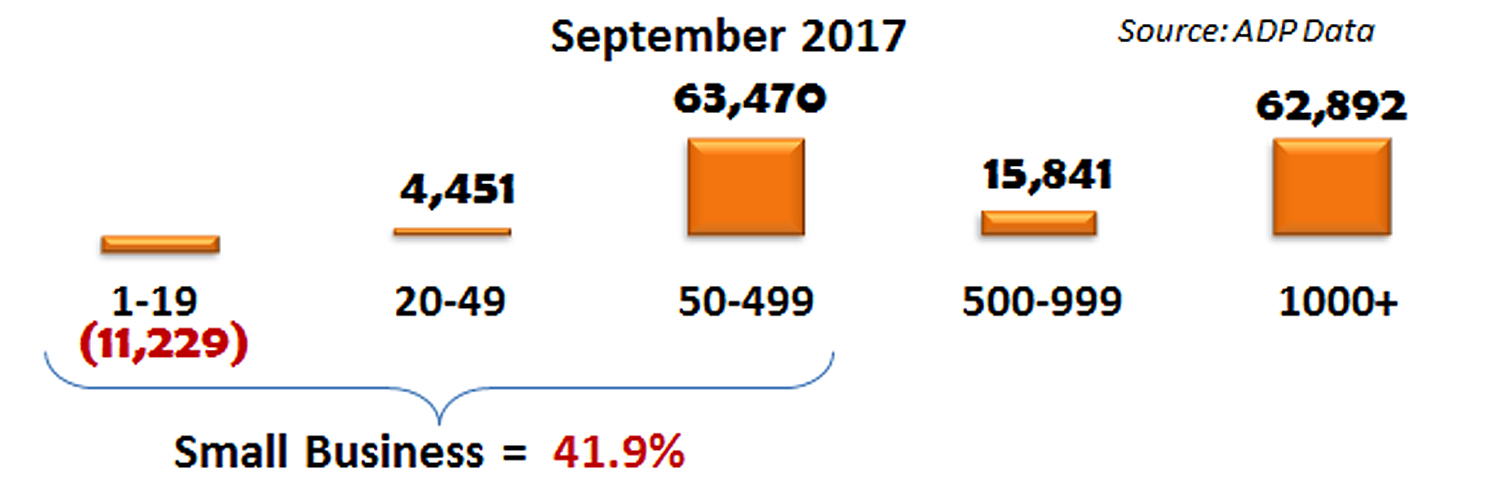
Last month (September 2017), U.S. small business (1-499 employees) created 41.9% of all new jobs, which compares unfavorably with 51.7% in August, 74.6% in July, 68.4% in June, 77.2% in May, 72.2% in April and 81.9% in March. Micro-businesses (1-19 employees) lost 11,229, which is the first loss during the Trump Administration and the greatest loss of micro-businesses since December 2013. Most economists attribute this loss largely due to Hurricanes Harvey and Irma. While Jobenomics agrees, it also signals a systemic problem in the rapid decline in small businesses and the dearth of small business startups.
11,000 losses occurred in micro-businesses (1-19 employees), which is the third such loss in the last 80-months. Alarmingly, over the last 80-month period, micro-business job creation has dropped by two-thirds, from an average of 63,000 new jobs during the first 6-months of the time span to 20.000 for the last 6-month period. Micro-businesses underpin the U.S. economy. Continued denigration of these businesses can only led to economic stagnation.
Of the 4 million micro-businesses created over the last decade, tens of thousands of ultra-high growth businesses (called unicorns and gazelles) have generated millions of net new jobs for America. According to the Kauffman Foundation, these fleet-footed startups account for 50% of all new jobs created. Uber, Lyft, Airbnb, SpaceX, WeWork and Pinterest are recent examples of unicorns—a startup company that rapidly achieves a stock market evaluation of $1 billion or more. A gazelle is high-growth company (of any size, but usually a recent entrepreneurial startup or micro-business) that increase revenues by over 20% per year for over four years or more. The top-10 U.S. gazelles include Natural Health Trends, Paycom Software, Lending Tree, ABIOMED, MiMedx Group, Facebook, NetEase, Ellie Mae, Amazon.com and Arista Networks, according to Fortune magazine.
Micro-businesses are the life blood of the emerging digital economy that will equal the size and scope of today’s traditional economy within the next few decades. If America fails to compete effectively in the global digital economy, it will quickly be relegated to a back-bench position to countries like China. China has a much superior digital economy strategy and a public/private implemention effort than the United States. For information on this topic, download the Jobenomics’ “China’s Digital Economy Quest” report at https://jobenomicsblog.com/chinas-digital-economy-quest/.
Jobenomics Analysis of Various Economic Reports.
The rate of small business creation is dropping precipitously. Business startups are the seed corn of the U.S. economy. Without the planting and fertilization of these seedlings the fields of American commerce will be fallow.
In terms of new starts (firms less than 1-year old), the Census Bureau’s Business Dynamic Statistics (BDS) indicate that the United States is now creating startup businesses at historically low rates, down from 16.5% of all firms to 8% in 2014 (latest data). Based on a Wall Street Journal (WSJ) analysis of this Census Bureau data, “If the U.S. were creating new firms at the same rate as in the 1980s…more than 200,000 companies and 1.8 million jobs a year” would have been created.
According to a Census Bureau’s BDS press release on 20 September 2017, in 2015, 414,000 U.S. startup firms created 2.5 million new jobs, which is well below the pre-Great Recession average of 524,000 startup firms and 3.3 million new jobs per year for the period 2002-2006. In 2015, job creation minus job destruction equaled net job creation of 3.1 million, which supports the Jobenomics hypothesis that net job creation is far more important statistic for policy-makers that just focusing on only new jobs. Other tidbits of the 2017 BDS press release include:
- In 2015, 5 million U.S. small businesses (1-499 employees) created 45% (1,400,711) of all net job creation compared to 20 thousand large business (500+ employees) 55% (1,690,591) net job creation.
- In 2015, 4.5 million micro-businesses (1-19 employees) net job creation equated to 14% (434,203) of all net new jobs. Most of these jobs were produced at the base of America’s socioeconomic pyramid, a demographic that receives little attention from big business. If U.S. policy-makers paid as much attention to small and micro-business net job creation, the U.S. labor force and economy would be far more robust than it is today.
- In 2015, net job creation in urban areas was over twice the rate of rural areas, or 2.7% versus 1.2% respectively. This supports Jobenomics assertion that urban renewal, with emphasis on blighted inner-city communities, will not only create the maximum number of new jobs but will also produce positive collateral benefits of poverty and crime reduction.
According to another Kauffman Foundation analysis of the Census Bureau’s Business Dynamic Statistics, most city and state government policies that look to big business for job creation are doomed to failure because they are based on unrealistic employment growth models. “It’s not just net job creation that startups dominate. While older firms lose more jobs than they create, those gross flows decline as firm’s age. On average, one-year-old firms create nearly 1,000,000 jobs, while ten-year-old firms generate 300,000. The notion that firms bulk up as they age is, in the aggregate, not supported by data.”[10]
Jobenomics agrees with both the WSJ and Kauffman analyses. Moreover, the Jobenomics 20-part series, entitled President Trump’s New Economy Challenge (which is posted on the Jobenomics.com website from 6 February 2017 to 10 April 2017) provides a detailed analysis why the Trump Administration’s bold economic (4% GDP) and job creation (25 million new jobs) vision is likely to fall short due to its concentration on big business rather than small business creation and sustainment.
Not only is small business critical to net job creation is the primary determinant for GDP growth given the fact that big businesses are increasing looking at automation and outsourcing (to foreign workers or domestic contingency workers) to replace the standard full-time labor force. The ideal rate for U.S. GDP growth is around 3%. Any GDP growth below 2% is considered sclerotic growth that makes the U.S. economy vulnerable to financial downturns.
Real GDP Quarterly Percent Change This Decade
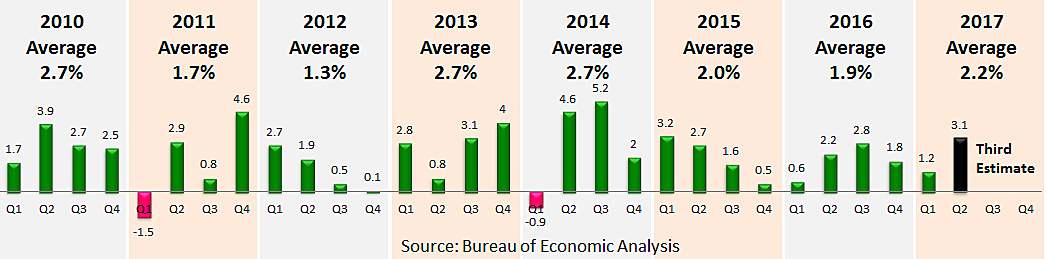
According to the U.S. Bureau of Economic Analysis (BEA), during the post-recession recovery period from Q1 2010 through Q2 2017, U.S. GDP averaged 2.3%. In 2015 and 2016, U.S. GDP grew by subpar rates of 2.0% and 1.9% respectively. During the first two quarters of the Trump Administration, GDP averaged 2.2%.[11]
Q1 2017 (January, February and March 2017)’s GDP final estimate was a subpar 1.2%—up from an abysmal “advance” estimate of 0.7%, equal to the 1.2% “second” estimate, and down from the 1.4% “third” estimate. Regardless of estimate, Q1 GDP data was not good news for the new Trump Administration. However, these low percentages can be rationalized as a carryover from the previous Administration.
Q2 2017 (April, May and June 2017)’s GDP “second” estimate (latest) is 3.1%, up from an “advance” estimate of 2.6%—a significant improvement over Q1 and a good sign for President Trump’s stated goal of raising U.S. GDP growth to 4.0%.[
The BEA’s advance estimate for Q3 2017 (July, August and September 2017) is scheduled for release on 27 October 2017. However, there are a number of other highly credible prognosticators that are making Q3 2017 forecasts. The Federal Reserve Bank of Atlanta’s GDPNow forecast model for Q3 2017 is 2.5% as of 9 October 2017, down from an initial 4.0% forecast on 1 August 2017. The “Blue Chip” survey of the bottom 10 and top 10 leading business economists forecast that Q3 2017 growth will eventually fall between 1.7% and 2.7%. The negative economic and labor force impacts of Hurricanes Harvey (August 25 landfall in Texas), Irma (September 10 landfall in Florida) and Maria (September 10 landfall in Puerto Rico) will likely materialize in the Q3 2017 and Q4 2017 GDP and employment reports.
While GDP growth does not insure employment growth, sclerotic GDP growth discourages business hiring, consumer spending and labor force expansion. Sclerotic GDP growth also discourages lower rates of unemployment and voluntary workforce departures. Negative GDP growth creates recessions and depressions depending on the severity and longevity of the contracting economy.
The period of sclerotic GDP growth from 2000, has dramatically impacted the American middle-class and the U.S. labor force that this is weaker by 11 million workers today than at the beginning of the 21st Century. For most American workers, real wages (purchasing power) have not increased significantly for decades and are not projected to improve anytime soon. America’s aggregate household income has shifted from middle-income to upper-income households, causing many middle-class workers to leave the workforce altogether. The solution to building a robust middle-class is to accelerate GDP growth, which requires the creation of more productive private sector jobs, which, in turn, can only be generated by a massive expansion of the small business sector.
Concluding Thoughts.
President Trump’s vision of a “dynamic and booming economy” is one that can produce a GDP growth rate of “4% over the next decade”. This vision ultimately depends on mass-producing business, especially small business, in sufficient quantities to create 25 million net new jobs. Sclerotic (0% to 2%) or recessive (negative) GDP rates depreciate a government’s legitimacy. Robust GDP growth of over 3% will have the opposite effect.
According to the nonpartisan Congressional Budget Office’s 2017 to 2027 Budget and Economic Outlook report[, “over the next five years, the monthly increase in nonfarm payroll employment, which is estimated to average 160,000 jobs in the first half of 2017, is projected to settle down to an average of 64,000 jobs.” If this CBO forecast is correct, the next decade is likely to produce only 9 million American jobs, which is far short of President Trump’s projection of 25 million new jobs. Note: last year’s BLS Employment Projections: 2014-24 Summary report forecasts that the United States will produce only 9.9 million new jobs over the next decade.
Jobenomics tends to agree with these gloomy CBO and BLS forecasts for the reasons discussed in the Jobenomics 20-part series entitled President Trumps New Economy Challenge. However, the Trump Plan can be amended to change CBO and BLS labor force projections from negative to positive.
With proper leadership, the Administration can lift tens of millions of Americans out of poverty by making the following four structural changes to President Trump’s economic and job creation plan:
- Balancing the traditional standard industrial economy with the newly emerging nonstandard digital economy,
- Mitigating the mass-exodus of able-bodied workers who are voluntarily departing the U.S. labor force for lives of dependency and alternative (often illicit) lifestyles,
- Addressing the challenge of the ever-growing contingency workforce that will soon be the dominate form of labor in the United States, and
- Mass-producing small and self-employed businesses—the engine of the U.S. economy—and the employer of the vast majority of Americans.
If the Trump Administration can achieve 4% GDP growth in a stable global economy, the U.S. economy will boom and Americans will be euphoric. This feat will not be easy. The last year the United States reached 4% in a single year was 2001. The last time that the United State reached 4% in ten consecutive years during the last 50-years was never (3.5% was the highest from 1976 to 1985). Notwithstanding, if the Trump Administration can tie the 3.5% record over the next decade, they will be vindicated and worthy of much praise.
About Jobenomics: Jobenomics deals with economics of business and job creation. The non-partisan Jobenomics National Grassroots Movement’s goal is to facilitate an environment that will create 20 million net new middle-class U.S. jobs within a decade. The Movement has a following of an estimated 20 million people. The Jobenomics website contains numerous books and material on how to mass-produce small business and jobs as well as valuable material on economic and business trends. For more information see https://jobenomics.com/.

