

Jobenomics U.S. Employment Analysis: Q3 2016
By: Chuck Vollmer
19 November 2016
Jobenomics reports on U.S. unemployment and employment statistics, characteristics and trends. This 140-page Jobenomics U.S. Employment Analysis: Q3 2016 report focuses on the employed and working population, U.S. labor force gains, economic growth, income opportunity, contingent workforce, education and training, workfare, and city and state initiatives. The top three conclusions are:
- Near-term economic and employment outlook is positive.
- Mid-term economic and employment outlook is troublesome.
- Long-term challenges to economic and labor force growth include stemming voluntary workforce departures, dealing with contingent workforce expansion, improving sclerotic GDP growth, adjusting the population/workforce imbalance, providing better income opportunity and wages, and increasing the number of small businesses and startups.
The 70-page Jobenomics U.S. Unemployment Analysis: Q3 2016 report focuses on the unemployed and underemployed, labor force losses, economic sustainability, income inequality, voluntary workforce departures and non-working population, welfare, and the small business creation solution.
EXECUTIVE SUMMARY
Current State of the U.S. Labor Force. This chart is a snapshot the current state of the U.S. labor force in terms of current jobs in gray, new jobs in green and job losses in red.
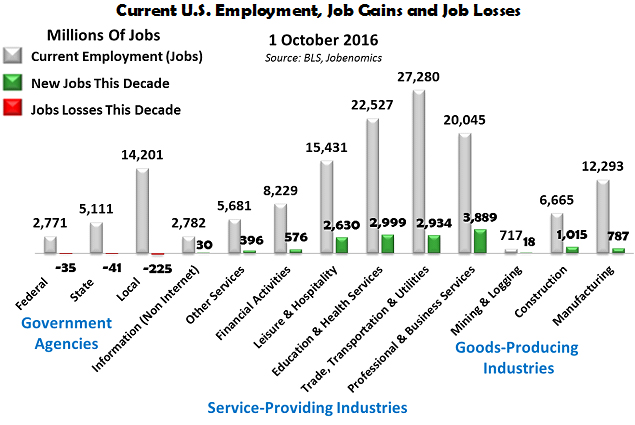
In general terms, the U.S. labor force is in a much better position today than it was in during the Great Recession. Seven private sector service-providing industries employ 71.2% of all U.S. workers (102,954,000) jobs, followed by federal, state and local governments that employ 15.3% of the workforce (22,181,000) jobs and by the three private sector goods-producing industries that employ 13.5% of the workforce (19,612,000). Job gains occurred in all 10 private sector industries this decade. Job losses occurred at all three levels of government (federal, state and local) this decade.
Positive Labor Force Trends. Employment and economic data were positive over the last quarter. Three areas are noteworthy: net labor force gains and losses, private sector service-providing industry growth, and continued small business strength.
- Labor Force Gains and Losses. Between 1 January 2010 and 1 October 2016, the United States created 14,973,000 new jobs with a net gain of 15,274,000 in the private sector and a net loss of 301,000 in government employment. During Q3 2016, 575,000 citizens entered the labor force, 333,000 fewer citizens were enrolled in the Not-in-Labor-Force (abled-bodied adults that chose not to work) for a net gain of 980,000, which was slightly offset by an additional 156,000 more citizens joining the ranks of the officially unemployed.
- Service-Providing Industry Growth. Private sector service-providing industry employment continues to grow now employing 103 million Americans. 20 million are employed by private sector goods-producing industries and 22 million are employed by government (federal, state and local, not including the Armed Forces and institutionalized citizens. 88% of all new jobs this decade were created by the seven industries in the service-providing sector. 5% of all new jobs were produced by the four leading service-providing industries (Professional & Business Services; Education & Health Services; Trade, Transportation & Utilities; Leisure & Hospitality). Manufacturing and Construction contributed 5.2% and 6.6%, respectively.
- Small Business Strength. 8% of all Americans are now employed by small businesses that created 77.6% of all new jobs this decade. In the last month of Q3 2016 (September), small businesses created 58.4% of all new jobs, which is good but substantially lower than the last month of previous quarters: 85.4% in Q2 2016 (June) and 80.6% in Q1 2016 (March).
Negative Labor Force Trends. Positive labor force trends are offset by six negative trends that threaten economic growth and stability. These trends include voluntary workforce departures, contingent workforce expansion, sclerotic GDP growth, population/workforce imbalance, low wages/income and declining business startups.
- Voluntary Workforce Departures. In Q3 2016, 333,000 fewer people were enrolled in the Not-in-Labor-Force category (voluntary departures of able-bodied adult workers who chose not to work). Since 2010, 14,973,000 labor force gains offset by 10,371,000 labor force losses by voluntary departures. It is important to note that these gains have occurred during a 6 3/4-year period free of any major U.S. financial crisis, which is not likely to continue in the foreseeable future. Since year 2000 through Q3 2016, 25,529,000 able-bodied workers voluntarily departed the U.S. labor force versus 13,967,000 workers who entered the labor force for a net loss of 11,562,000 workers. It is also important to note that this net loss does not include the number of unemployed (2.3 million more people are unemployed in 2016 than 2000) or population growth (42 million additional Americans today compared to 2000).
- Contingent Workforce Expansion. Contingent workers are defined by the U.S. government as “nonstandard” workers who work part-time by necessity (temporary and day workers) or by choice (freelancers, independent contractors and the self-employed). Today, the contingent workforce is approximately 61,000,000 employed Americans or 40% of the total employed workforce. By 2030, this number will grow to 80,000,000 or 50% of the U.S. employed workforce—a trend that is largely unknown to U.S. policy-makers and the American public.
- Sclerotic GDP Growth. Most economists believe that economic growth depends on employment and GDP growth. The ideal rate for U.S. GDP growth is 2% to 3%. Anything less than 2% is considered sclerotic growth, which makes the U.S. economy vulnerable to financial downturns. During the post-WWII recovery, U.S. GDP grew at an average rate of 3.5% which created tens of millions of new jobs each decade. Since 2000, U.S. GDP averaged 1.76%. During the post-recession recovery period from 2010 through Q3 2016, U.S. GDP averaged 2.1%. In Q1 and Q2 2016, U.S. GDP grew by an abysmal 0.8% and 1.4% respectively. The Bureau of Economic Analysis (BEA) “advanced” estimate for Q3 2016 is 2.9% but many experts forecast that the Q3 GDP is likely to be downgraded to around 2.1%. GDP for the entire 2016 year is likely to be between 1.4% and 1.8% (sclerotic growth) assuming no major financial or major international crises, which is a bold assumption considering today’s turbulent and volatile economic conditions.
- Population/Workforce Imbalance. As of 1 October 2016, out of a U.S. population of 325 million, 113 million private sector workers support 32 million government workers and contractors, 94 million able-bodied people who can work but chose not to work, 70 million who cannot work, and 16 million unemployed and underemployed. The U.S. economy is not sustainable with only 35% supporting an overhead of 65%. The growing contingent labor force, which consists of mostly lower paid wage earners, makes the overhead burden even more precarious. More people earning livable wages and having greater discretionary income must be productively engaged in the labor force for the U.S. economy to flourish.
- Low Wages/Income. According to the U.S. Census Bureau, Current Population Survey, 2015 Annual Social and Economic (ASEC) Supplement, out of a total of 160 million American workers 15-years old and over with earnings, 72% (115 million) were below mean income and 28% (45 million) were above mean income of $54,964 for full-time workers. If the 159 million adult citizens with no reported income were included, an astounding 86% of Americans make below average (mean) income. This imbalance is much larger than most people perceive and is a major contributor to the social unrest being exhibited today.
- Declining Business Startups. Business startups are the seed corn of the U.S. economy. Without the planting and fertilization of these seedlings the fields of American commerce would remain fallow. Unfortunately, small businesses and the startups are faltering. The United States is now creating startup businesses at historically low rates, down from 16.5% of all firms in 1977 to 8.0% in 2014. According to the Wall Street Journal analysis of U.S. government data, “If the U.S. were creating new firms at the same rate as in the 1980s, that would be the equivalent of more than 200,000 companies and 1.8 million jobs a year.”[1]
Jobenomics Q3 Assessment. While recent labor force gains have been positive, negative employment trends, coupled with the next financial downturn, threaten the U.S. economy and its labor force. From a Jobenomics perspective, job creation is the number one issue facing the U.S. in regard to economic growth, sustainment and prosperity. Jobs do not create jobs, businesses do, especially small businesses. Unfortunately, America is focused on big business and government employment solutions that have not been very effective growing the U.S. labor force.
Jobenomics is a strong advocate of big business and believes that a robust industrial base is paramount to American prosperity and security. Big business, the anchor tenant of the U.S. economy, is on an opposing track regarding job creation and is unlikely to create a significant amount of net new jobs in the foreseeable future due to automation of routine manual and cognitive tasks, foreign outsourcing and increased usage of domestic contingent workers.
Government can play a significant support role in small business creation, especially if they underwrite the mass-production of highly-scalable startups in the same way they supported the homebuilding and mortgage industries over the last fifty years via a number of government sponsored enterprises like Fannie Mae, Ginnie Mae and Freddie Mac.
Small business creation is unquestionably the best way to create tens of millions of new jobs. Not only is this true during today’s post-Great Recession recovery period, but during the Great Recession.
- Post-Great Recession Job Creation Comparisons (1 January 2010 to 1 October 2016). Over the last 6 ¾ years in this decade, small businesses created 77.6% of all new American jobs. [2]
- Small businesses (less than 499 employees) created 3.5-times more jobs as large businesses (over 500 employees), 13,752,995 versus 3,975,020 respectively.
- Micro businesses (less than 19 employees) created 4-times more jobs than very large institutions (over 1,000 employees), 3,863,425 versus 2,738,789 respectively.
- Pre-Great Recession Job Creation Comparisons (1 October 2006 to 1 October 2016). Exactly 10 years ago (prior to the onslaught of the Great Recession) to today, small businesses created 96.4% of all new American jobs.
- Small businesses (less than 499 employees) created 9-times more jobs as large businesses (over 500 employees), 7,327,092 versus 272,718 respectively.
- Micro businesses (less than 19 employees) created 9-times more jobs than very large institutions (over 1,000 employees), 2,875,545 versus 418,771 new jobs.
Based on this data, one can safely conclude that small business is truly the engine of U.S. job creation in both recessionary and non-recessionary environments. However, compared to the last 10-year period the most recent 6 ¾-year period, the small business engine has slowed from producing 26.9-times to 3.5-times as many jobs. A large part of this dramatic difference in ratios is due to massive big business downsizing and outsourcing of jobs during the recession. Another explanation involves today’s burdensome regulatory and adverse lending environment that is making small businesses harder to start and grow.
The U.S. economy cannot be sustained by 113 million (35%) working citizens supporting an overhead of 212 million (65%) non-working citizens. More people must be productively engaged in the labor force for the U.S. economy to flourish. A vibrant labor force depends on a well-trained, disciplined, and engaged labor force. The antidote to unemployment and voluntary workforce departures is employment and meaningful career opportunities.
New small, emerging and self-employed businesses could create 20 million new jobs within a decade, if properly incentivized and supported. Three prominent areas of focus are: filling 6.1 million unfilled U.S. job openings, and exploiting the 10s of millions of new jobs generated by Energy Technology and Network Technology Revolutions. If Jobenomics can help create thousands of highly-scalable small businesses, America writ-large can facilitate the creation of millions of small businesses that would transform our economy.
If American policy-makers and decision-leaders are serious about revitalizing the economy and reversing the eroding middle-class, they must aggressively grow the labor force, reduce voluntary workforce departures, and address contingent workforce and below mean income issues. As discussed herein, Jobenomics believes that the place to start is with demographics with the greatest need and potential (i.e., women, minorities, new workforce entrants and the growing cadre of poor white males). Jobenomics suggests that policy-makers, in both parties, should make solutions to these labor force challenges their top priority.
Jobenomics deals with economics of business and job creation. The Jobenomics National Grassroots Movement’s goal is to facilitate an environment that will create 20 million new middle-class U.S. jobs within a decade. The Movement has a following of an estimated 15 million people. The Jobenomics website is now averaging about 800,000 hits (80,000 page views) per month, which is 400% higher than this time last year, which signals a high level of interest from the general public on mass-production of small business and jobs at the base of America’s socioeconomic pyramid.
About Jobenomics.
Jobenomics (Jobs + economics) deals with economics of business and job creation. The Jobenomics National Grassroots Movement’s goal is to facilitate an environment that will create 20 million new middle-class U.S. jobs within a decade. The Movement has a following of an estimated 15 million people. The Jobenomics website now averages 800,000 hits (80,000 page views) per month, which is 400% higher than the year prior. Jobenomics reports include quarterly employment and unemployment analyses, and specialty reports on the U.S. labor force, emerging U.S. and global business and labor force trends, and economic growth, sustainability and security.
While Jobenomics addresses big business and government employment trends, its principal focus is on highly-scalable small and self-employed businesses that employ the vast majority of Americans and create the vast amount of new jobs. Jobenomics has six state and city initiatives that are led by community leaders to mass-produce highly-scalable small businesses and jobs. To accelerate small business creation, Jobenomics is working with community leaders to promulgate local workfare initiatives, implement community-based business generators to mass-produce startup businesses, and provide workforce skills-based training, certification and funding programs.
Jobenomics prioritizes its efforts on citizens at the base of America’s socioeconomic pyramid with emphasis on engaging more women, minorities, youth (Gen Z/Y) and the working poor in the business and employment process. While Jobenomics is designed as a U.S. small business and job creation movement, other nations expressed interest in starting similar movements.
Click to Download this Employment Report
Download Unemployment and other reports at: http://Jobenomics.com
[1] Wall Street Journal, Sputtering Startups Weigh on U.S. Economic Growth, 23 October 2016, http://www.wsj.com/articles/sputtering-startups-weigh-on-u-s-economic-growth-1477235874?mod=djem10point
[2] ADP, National Employment Report, Historical Data, http://www.adpemploymentreport.com/

