

Private sector businesses create the types of jobs that generate economic growth. Big business is the anchor tenant of the U.S. economy. Small businesses are the engine of the economy, employing almost three-quarters of all Americans and creating three-quarters of new jobs this decade. Startup businesses are the seed corn of the future economy. Single-person nonemployer firms are the overlooked segment of the economy. (Download this Posting)
According to the U.S. Small Business Administration (SBA), there are 29.6 million U.S. small businesses with less than 500 employees compared to 19,000 big companies (0.1%) with over 500 employees. Of the 29.6 million small businesses, 5.8 million (19.5%) had paid employees, and 23.8 million (80.4%) had no employees, termed “nonemployers.” [1] [2]
The BLS definition of a nonemployer business is “one that has no paid employees, has annual business receipts of $1,000 or more ($1 or more in the construction industries), and is subject to federal income taxes”. Nonemployer businesses include:
- Individual proprietorships, sole proprietorships, an unincorporated business owned by individual and self-employed persons,
- Partnerships or unincorporated businesses owned by two or more persons having a shared financial interest in the enterprise, and
- Corporations that are legally incorporated businesses under state laws.[3]
Key Employer Business Statistics
Source: ADP National Employment Report[4]
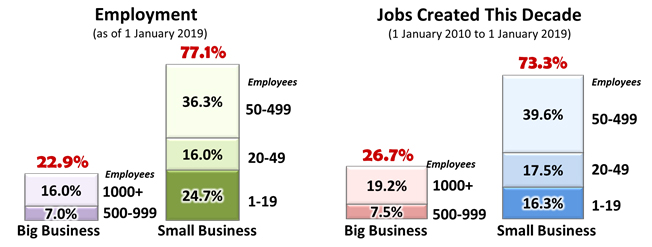
The 29.6 million U.S. small businesses currently employ the majority of all Americans and created the majority of all new U.S. jobs this decade. Today, as of 1 January 2019:
- Small businesses employ1% of Americans in the U.S. private sector.
- Small businesses (less than 500 employees) employ 3.4-times more citizens than large companies (500+ employees), or 98,439,000 versus 29,269,000 jobs respectively.
- Micro businesses (1-19 employees) employ 1.6-times more than very large institutions (1,000+ employees), or 31,607,000 versus 20,387,000 jobs respectively. 87F144F[5]
Since the beginning of this decade to today (1 January 2010 to 1 January 2019), small and micro businesses created the vast majority of all new jobs:
- Small businesses created 73.3% of all new jobs in the United States.
- Small businesses (less than 500 employees) created 2.8-times more jobs than large companies (500+ employees), or 14,729,000 versus 5,356,000 new jobs respectively.
- Micro businesses (less than 20 employees) created 85% as many jobs as very large institutions (over 1,000 employees), or 3,270,000 versus 3,847,000 new jobs respectively. 145F[6]
It is a common misconception that small businesses are only involved in service-providing industries whereas large major corporations dominate goods-producing sectors.
Industry Employment by Company Size
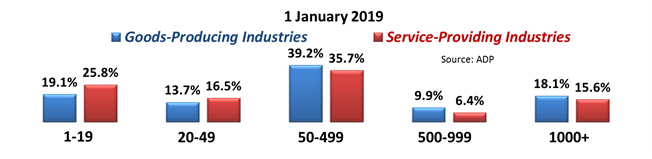
The ADP National Employment Report, a monthly survey of workers in 400,000 U.S. private sector businesses by the ADP Research Institute in collaboration with Moody’s Analytics, indicates that small business has a significant role in both the Goods-Producing and Service-Providing supersectors. According to the December 2018 ADP National Employment Report,
- The U.S. Goods-Producing industries have a total 20,694,000 employees, of which small businesses provide jobs for 72% (14,902,000) of the total.
- The U.S. Service-Providing industries have a total 107,015,000 employees, of which small businesses provide jobs for 78% (83,537,000) of the total.[7]
This data supports the fact that small employer firms produce far more jobs than big businesses.
Single-Person Nonemployer Businesses
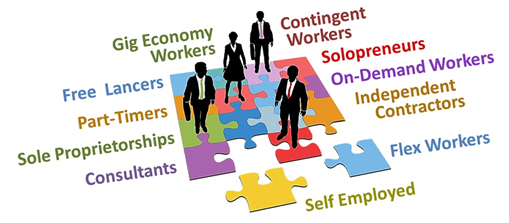
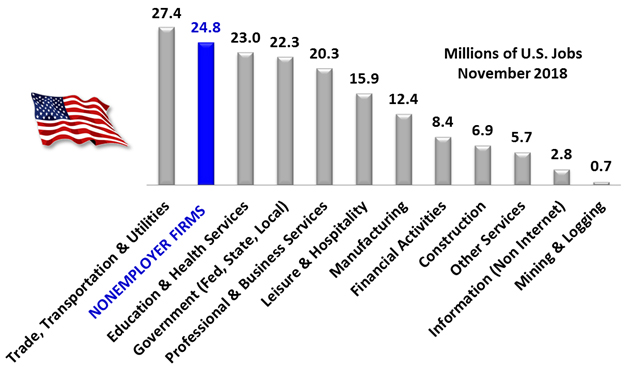
A nonemployer is a small business that has no paid employees. Nonemployer businesses are generally small incorporated or unincorporated self-employed businesses and independent contractors. There are 24.8 million single-person nonemployer establishments in the United States that employ (i.e., the owner) approximately one-fifth as many people as employer establishments.
Regrettably, but few American decision-makers know much or anything about them. The U.S. government excludes nonemployer ownership from their leading labor force statistical analysis. The reason for this is because the leading monthly government surveys focus on employer businesses and the general population characteristics.[8] The Census Bureau does produce an annual Nonemployer Statistics (NES) series that provides subnational economic data for firms that have no paid employees and are subject to federal income tax.”[9] The NES also has other restrictive conditions that leads Jobenomics to believe that the actual number of nonemployer firms is much larger than 25 million.
Employees per Industry Supersector
The Census Bureau’s 2012 Economic Census’ Survey of Business Owners (latest data) calculated that U.S. business had annual business receipts of $33.5 trillion, which is defined by the Bureau as the “total sales, shipments, receipts, revenue, or business done by domestic establishments (excludes foreign subsidiaries) with and without paid employees and within the scope of the Survey of Business Owners.” 5,424,458 employer firms accounted for 97% ($32.5 trillion) and 22,201,902 nonemployer firms accounted for the remaining 3% ($1.0 trillion) of the annual receipt total. [10]
As of a result of this “small economic impact” (3%), the Bureau of Labor Statistics “excludes” nonemployer statistics from their leading employment reports that provide the basis for almost every major U.S. government economic and labor force report and U.S. policy-making.[11]
The statement that nonemployers have “small economic impact” is not supported by government data and appears to either be politically-motivated or naïve. The premise that nonemployers contribute only 3% ($1 trillion) of the annual receipt total ($33.5 trillion) is correct. However, as shown below, 60% of the major U.S. industrial sectors contribute even less.
Annual Receipts of U.S. Businesses By NAICS Code
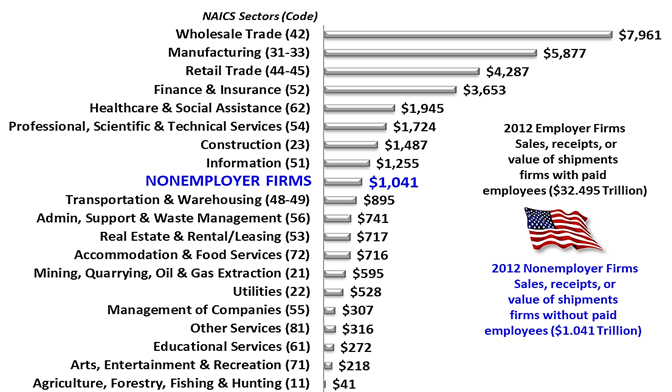
The $1 trillion economic contribution of Nonemployers exceeds the majority of major private sector industries including Transportation & Warehousing; Agriculture, Forestry, Fishing & Hunting; Arts, Entertainment & Recreation; Educational Services, Other Services, Management of Companies, Utilities, Mining, Quarrying, Oil & Gas Extraction; Accommodation & Food Services, Real Estate & Rental/Leasing, and Admin, Support & Waste Management. These industries are addressed monthly in the BLS Employment Situation Summary report—the leading report for policy-makers, decision-leaders, media-pundits, and macro-economists.
Jobenomics asserts that excluding 24.8 million single-person nonemployer establishments that have a “greater economic impact” than 60% of the major industrial sectors is wrongheaded and will be discussed in more detail in a subsequent posting in this Year Ahead Report series.
Businesses create jobs that produce goods and services (GDP) to satisfy a nation’s needs and wants. Consequently, a healthy business environment is essential to generating new jobs that are essential to meeting the needs of a growing population. Compared to population growth, American businesses are growing today at one-fourth the rate than they did in the 1990s.
Jobs versus Population Growth
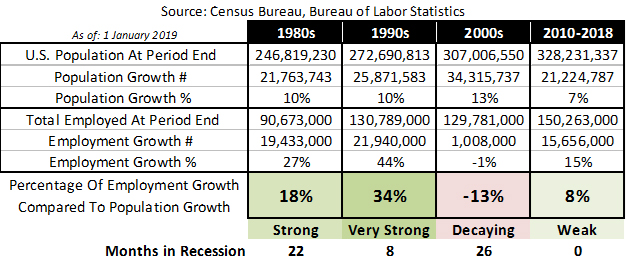
The rate of U.S. job growth far exceeded population growth in the 1980s and 1990s, 18% and 34% respectively. This extraordinary growth expanded the middle class and the belief in the American Dream. It also provided income opportunities for tens of millions of people and cushioned the workforce during 26-months of recession. Then the bottom fell out.
From 2000 to 2009, 26-months of recession stagnated workforce growth during a period where U.S. population outgrew the labor force by 13%. During this era, the U.S. suffered a net loss of approximately 1 million jobs compared to population growth of 34 million people. So far this decade, employment growth outpaced population growth by a meager 8% during a recession-free period that is expected to continue through 2019.
GDP versus Job Growth by Company Size This Decade (2010-2018)
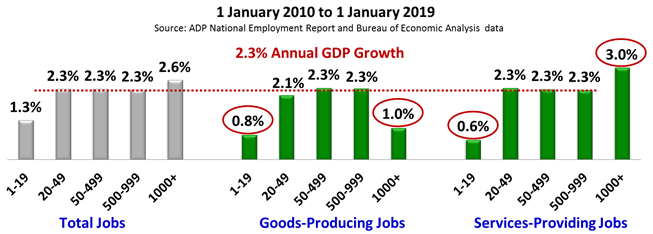
Regarding job growth, only very large (1000+ employee) service-providing companies performed better (3.0%) than average annual GDP growth (2.6%).
Big goods-producing corporations (mainly manufacturing) grew at only 1.0% this decade. However, President Trump’s manufacturing emphasis is beginning to bear fruit with overall manufacturing growth at 4.0% during 2017 and 2018. The year 2019 should be even better since most of the U.S. major trading partners have agreed to more equable trade agreements. China, responsible for half of the U.S. trade deficit in both 2017 and 2018 through October, is the last major holdout but will eventually agree to a compromise that will be more balanced. If this happens, 2019 should be an outstanding year for most U.S. industries. If it doesn’t, 2019 could be very bad for business.
Micro-businesses grew between 0.6% and 0.8% which is significantly less than GDP growth. Other than a few unicorns (a startup company valued at over $1 billion) and gazelles (a high-growth company that has been increasing its revenues by at least 20% annually for four years or more starting from a revenue base of at least $100,000), the U.S. business engine is faltering, and business startups dropped to 30-year lows.
Regarding new starts (firms less than 1-year old), the Census Bureau’s Business Dynamic Statistics indicate that the United States is now creating startup businesses at historically low rates, down from 16.5% of all firms to 8% in 2014 (data range from 1977 to 2014). [12] Based on a Wall Street Journal (WSJ) analysis of this Census Bureau data, “If the U.S. were creating new firms at the same rate as in the 1980s…more than 200,000 companies and 1.8 million jobs a year” would have been created. [13]
Declining Number Startup Business
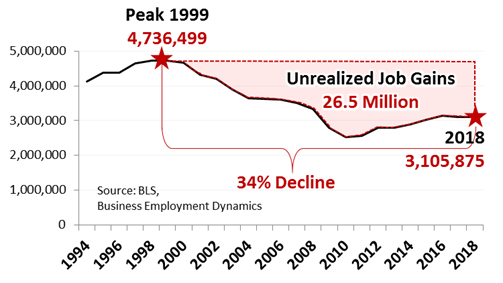
Jobenomics derived this chart from a recent BDS data report for startup firms less than one-year-old. Startup firms include various size classes of employer businesses from 1 to 4, 5 to 9, 10 to 19, 20 to 49, 50 to 99, 100 to 49, and 500+ employees. Micro-business (1-19 employees) created 77% of all new jobs from 1999 through 2018. Other small businesses (19-99) added 19% more jobs. Medium-sized businesses (100-499) added 4% and large businesses (500+) added 1% of the total. [14]
As shown, over the last 20-year period, the peak number of jobs created by all firms less than one-year-old was in 1999 that generated 4,736,499 new jobs. From peak to today, the number of startup jobs created decreased 34% to 3,105,875 in 2018. If the United States maintained the same level of production at 1999 levels, unrealized workforce gains would have amounted to 26.5 million new jobs, or 1.4 million jobs per year—a figure very close to the 2016 WSJ prediction of 1.8 million jobs.
The World Bank’s Business Rankings 2018
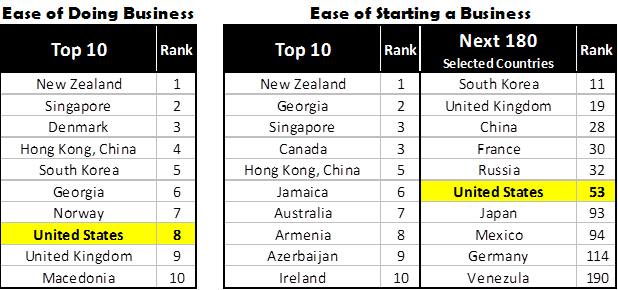
While the United States is a remarkable place for doing business, America falls short in making it easy to create a company. According to The World Bank, out of 190 nations, the United States ranks 8th in Ease of Doing Business and 53rd in Ease of Starting a Business.[15]
From a Jobenomics perspective, the Trump Administration’s business and job creation initiatives (tax cuts, regulatory reform, and balanced trade policies) are necessary to grow the economy. However, today’s partisan Congress, divided electorate and so-called resistance movement could undermine these initiatives.
Greater attention needs to be focused by the Administration, Congress and economic development professionals across the United States on small business and workforce development in communities stuck at the bottom of America’s socio-economic pyramid. The 2017 Tax Cut & Jobs Act included legislation for 8,700 Opportunity Zones (12% of U.S. Census tracts) in under-resourced urban and rural communities. The Act also included provisions for Opportunity Funds and generous capital gains deductions that could motive tens of billions of dollars’ worth of investing in these financially-distressed communities.
Economic growth depends on GDP growth, which is dependent on businesses that create the means (jobs) to deliver goods and services. When an economy grows at negative or sclerotic GDP rates, instability and unrest occur, and governing institutions lose their sense of legitimacy as evidenced by what’s happening globally today. The erosion of America’s middle-class and the American dream over the last several decades is one of the principal reasons for the growing interest in socialism.
In many ways, the rise in socialism in the United States is proportional to the increase in American casino-capitalism. Casino-capitalism involves making money on money as opposed by making money on labor. Casino-capitalism benefits the wealthy few. On the other end of the political spectrum is socialism that is mistakenly advertised to solve the needs of the many. To reunite our divided electorate, the United States needs to return to inclusive-capitalism (Jobenomics’ focus) where citizens can achieve self-sufficiency and upward-mobility by making money on their labor or laboring collectively with other workers in a small business environment that promotes unity, good-fellowship, and purpose.
Jobenomics concentrates on the economics of business and job creation. The non-partisan Jobenomics National Grassroots Movement’s goal is to facilitate an environment that will create 20 million net new middle-class U.S. jobs within a decade. The Movement has reached an estimated audience of 30 million people. The Jobenomics website contains numerous books and material on how to mass-produce small business and jobs as well as valuable content on economic and industry trends. For more information see Jobenomics.com.
[1] Note: startups, micro and small employer businesses and nonemployer firms are discussed in subsequent postings in this Year Ahead report in more detail.
[2] U.S. Small Business Administration, Office of Advocacy, Frequently Asked Questions, https://www.sba.gov/sites/default/files/advocacy/SB-FAQ-2017-WEB.pdf
[3] BLS, Nonemployer Definitions, https://www.census.gov/epcd/nonemployer/view/define.html
[4] ADP National Employment Report, http://www.adpemploymentreport.com
[5] ADP Research Institute, Historical Data, http://www.adpemploymentreport.com
[6] ADP Research Institute, Historical Data, http://www.adpemploymentreport.com
[7] ADP Research Institute, April 2018: ADP Employment Reports, https://www.adpemploymentreport.com/
[8] The U.S. government perceives that nonemployer businesses have limited economic impact and relies solely on income tax records provided by the Internal Revenue Service rather than detailed Census Bureau surveys like the monthly Current Population Survey (CPS), commonly known as the Household Survey, and monthly Current Employment Statistics (CES), commonly known as the Establishment Survey.
[9] U.S. Census Bureau, Nonemployer Statistics (NES), https://www.census.gov/programs-surveys/nonemployer-statistics/about.html
[10] U.S. Census Bureau, American Fact Finder, 2012 Survey of Business Owners, https://factfinder.census.gov/faces/tableservices/jsf/pages/productview.xhtml?pid=SBO_2012_00CSA01&prodType=table
[11] The BLS Employment Situation Summary report uses a combination of Establishment Survey Data and Household Survey Data provided by the Census Bureau. The Establishment Survey (officially known as the Current Employment Statistics survey or CES) excludes nonemployer firms. The Household Survey (officially known as the Current Population Survey or CPS) includes a limited sampling of nonemployer firms such as self-employed persons. For more information see Understanding the employment measures from the CPS and CES survey at https://www.bls.gov/opub/mlr/2006/02/art2full.pdf
[12] U.S. Census Bureau, Business Dynamics Statistics, Firm Characteristics Data Tables, Firm Age, https://www.census.gov/ces/dataproducts/bds/data_firm.html
[13] Wall Street Journal, Sputtering Startups Weigh on U.S. Economic Growth, 23 October 2016, http://www.wsj.com/articles/sputtering-startups-weigh-on-u-s-economic-growth-1477235874?mod=djem10point
[14] U.S. Bureau of Labor Statistics, Business Employment Dynamics, Research Data on Business Employment Dynamics by Age and Size, Table 1-A-E: Annual gross job gains and gross job losses by age and average size of establishment, https://www.bls.gov/bdm/business-employment-dynamics-data-by-age-and-size.htm
[15] The World Bank, Doing Business, 2018 Rankings & Ease of Doing Business Score, http://www.doingbusiness.org/en/rankings

