

Basic knowledge on how the U.S. government defines labor force and accounts for the different labor force categories is essential to understanding labor force statistics and interpreting fact from fiction. According to the U.S. Bureau of Labor Statistics (BLS), the basic concepts involving employment and unemployment are straight forward. People are unemployed if they do not have a job, actively looked for work in the prior four weeks, and currently available for work. The BLS classifies persons who are neither employed nor unemployed as “Not in the labor force”. While employment and unemployment statistics are important, the explosive growth of people in the Not-in-Labor-Force Category is the most daunting challenge facing American policy-makers and the American public. Download, at no cost, this posting, other Year Ahead postings and Jobenomics economic, community, business, and workforce development documents in the Jobenomics Library.
U.S. Labor Force Overview
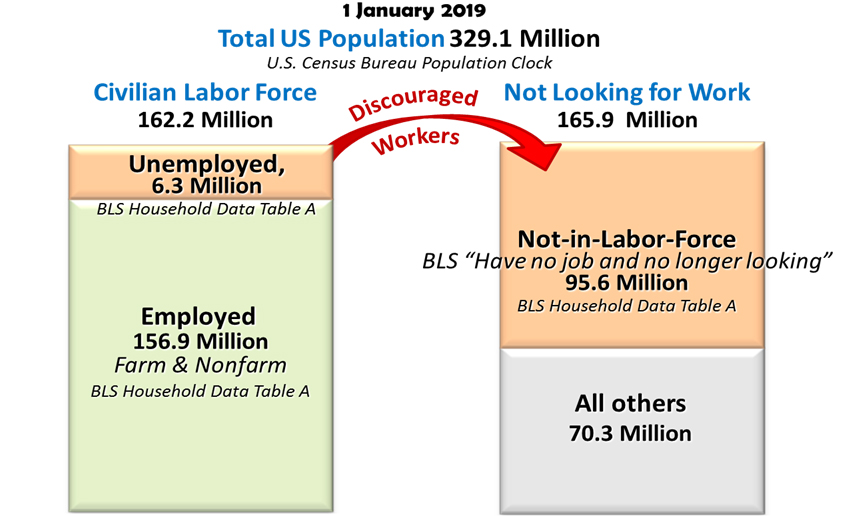
Therefore, as shown:
- Civilian Labor Force = Employed + Underemployed + Unemployed = 162.2 million.
- Not Looking for Work = Not-in-Labor-Force + All Others = 165.9 million.
The Civilian Labor Force includes citizens, who are either employed or unemployed looking for a job, are at least 16 years old, are not serving in the U.S. armed forces and are not institutionalized.
- The U.S. labor force consists of 156.9 million workers in the farm (approximately 2.6 million direct on-farm employees and 1.0 million direct forestry/fishing employees[1]) sector, ten non-farm private sector goods-producing and service-providing industries, and three government sectors (federal, state and local).6F9F[2]
- There are 6.3 million unemployed (the “official” U3 total unemployed as a percent of the civilian labor force U3) people who are looking for work. The BLS reports on six unemployed categories from U1 long term employed to U3 officially unemployed to U6 total unemployed plus all marginally attached workers and total part-timers that work for economic reasons (i.e., have to work involuntarily part-time primarily due to “slack work” conditions, excluding people who voluntarily chose to work part-time).
The Not Looking for Work cadre includes Not-in-Labor-Force and All Others.
- Not-in-Labor-Force includes people (over 16 years old) such as discouraged workers, citizens who choose not to work, welfare recipients, students, retired, stay-at-home caregivers, etc. There are 95.6 million in the BLS’ Not-in-Labor-Force category that has grown substantially over the last 18-years.
- All Others includes the remaining 70.3 million citizens (mainly children) in the U.S. population not covered in the previous three BLS categories.
The BLS does not survey or report this “All Others” category, which includes children, elderly, disabled, institutionalized (approximately 4 million citizens in correctional institutions, mental institutions, detention facilities, skilled nursing facilities, hospice facilities and other long-term care living arrangements), and serving in the U.S. armed forces (approximately 1.3 million on active duty).
Labor Force Gains versus Labor Force Losses. Most Americans assume that a good economy creates jobs. This assumption is a backward supposition. Good jobs create a healthy economy. However, private sector businesses create jobs that fuel economic growth. Therefore, it is imperative to have a robust business sector that creates an ever-increasing amount of well-paying goods-producing and service-providing jobs that sustain a healthy economy.
Three different approaches are used to measure the health of the U.S. economy: (1) an income approach (compensation, profits, and taxes), (2) a production approach (value of everything produced), and (3) an expenditure approach (consumption, investment, government spending, and net exports). All three measurements depend on robust goods-producing and service-providing jobs.
U.S. Labor Force Gains and Losses Since 2000
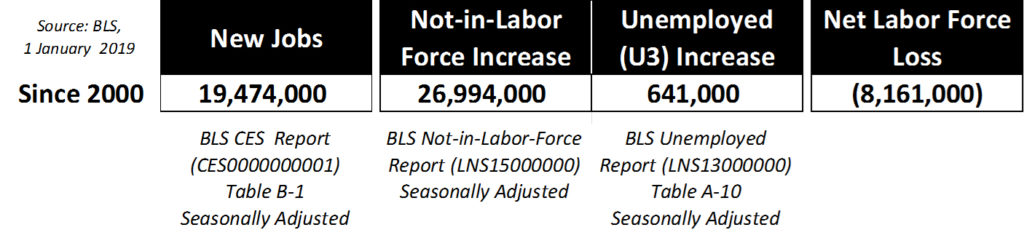
The Bureau of Labor Statistics (BLS) Employment Situation Summary reports that since the turn of the Century (1 January 2000), the United States added 19,474,000 new jobs.[3] On the negative side of the labor force ledger, the “Not-in-Labor-Force” category (a category reserved for Americans who can work but choose not to work) increased by 26,994,000 voluntary departures, and 641,000 additional citizens joined the ranks of the official U3 unemployment category. Consequently, the U.S. labor force is weaker today by a net workforce loss of 8,161,000 Americans. This net loss is exacerbated by a population growth of 47 million additional American citizens present today compared to the year 2000 (282 million versus 329 million).
Historical Unemployment Rate (U3) Lows
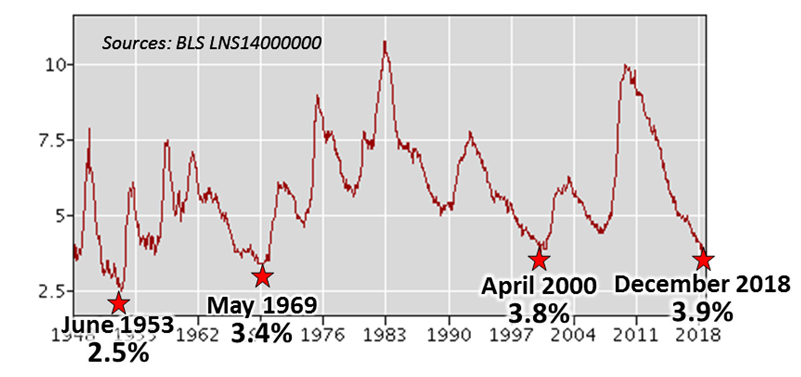
The significant decrease in the unemployment rolls marked a near post-Great Recession unemployment rate low of 3.9%. From a historical unemployment rate perspective, the post-WWII low was 2.5% in June 1953, followed by 3.4% in May 1969 and 3.8% in April 2000. Notwithstanding, the official U3 employment rate is a relatively artificial statistic since it depends on people “actively looking” for work. Once one quits looking, regardless of the reason, they are enrolled in the Not-in-Labor Category. Consequently, it is essential to gauge labor force strength by looking at a combined U3/NiLF number versus the number of Employed citizens.
While highly-advertised statistics (e.g., the stock market, official unemployment rate, and consumer confidence index) suggest that the U.S. economy is booming, underlying small business, labor force and wage statistics are not doing nearly as well.
Maintaining a Large Overhead Destabilizes the U.S. Economy
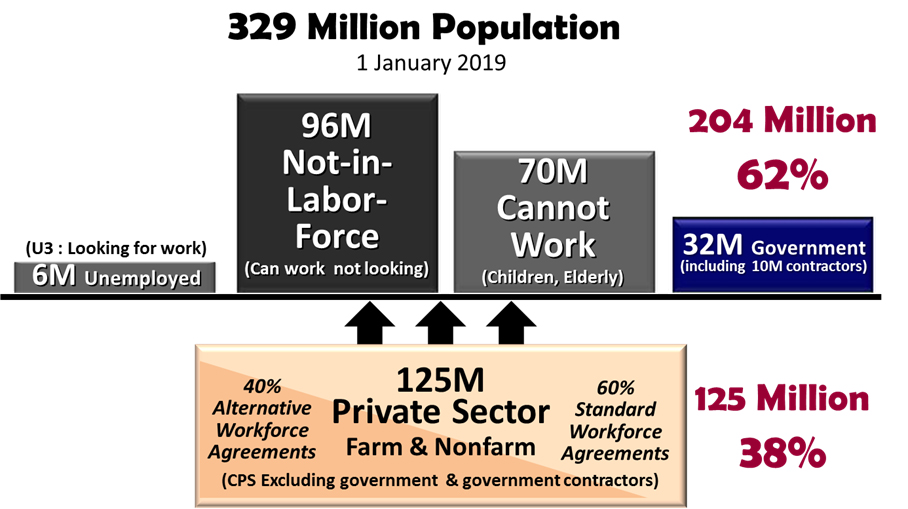
As of 1 January 2019, out of a total population of 329 million Americans, 125 million non-government private sector workers support 32 million government workers and government contractors, 96 million people who can work but chose not to work, 70 million who cannot work (children, elderly and institutionalized citizens), and 6 million unemployed citizens. Of the 125 million private sector workers, approximately 60% are standard full-time workers, and 40% are contingency workers (part-timers, freelancers, independent contractors, etc.) who make substantially lower wages, often with fewer or no benefits than their full-time counterparts.
While recent trends are slowly reversing America’s descent from an economic quagmire of the Great Recession, the U.S. economy is not yet sustainable without the continued strengthening of the U.S. non-government private sector labor force. Excluding an estimated 10 million government contractors in the private sector, the private sector workforce now consists of 117,858,000 workers[4], which represents 38% of today’s total U.S. population of 329,096,000.[5] The U.S. economy is not sustainable over the long-term with only 38% supporting an overhead of 62%.
Even though the United States made incremental improvements to the labor force during the post-Great Recession recovery era, the damage done to the labor force since the turn of the Century has considerably weakened the United States economically. The aftermath of the Great Recession also ushered in an age where an excessive number of people now choose non-working lifestyles than ever before. Many frustrated out-of-work citizens merely quit looking for employed and voluntarily join the ranks of side-lined individuals who are reliant on public assistance, family and friends, or retirement savings. Worse yet, the American middle-class has eroded to the point where the proverbial American dream is now a myth for many struggling to make ends meet and the hope of a better future is more of an illusion than a reality. According to the Pew Research Center, “Once in the clear majority, adults in middle-income households in 2015 were matched in number by those in lower- and upper-income households combined.”10F11F[6]
To better understand how these statistics are derived, one must have basic knowledge of how the U.S. government collects and report labor force data. The two primary sources of data are from joint Census Bureau/BLS household surveys and BLS industry surveys. The “Household” survey collects data via the Current Population Survey (CPS) and the “Establishment” payroll survey via the Current Employment Statistics (CES).11F12F[7]
- CPS Household data is collected monthly from a sample from over 60,000 American households and includes comprehensive data on the labor force, the employed, and the unemployed classified by such characteristics as age, sex, race, family relationship, marital status, occupation, and industry attachment. The CPS also provides data on the demographics and past work experience of those not in the labor force. The CPS includes all workers, nonfarm and farm, and estimates current employment at 163.2 million.
- CES Establishment data is collected monthly from a sample of approximately 143,000 businesses and government agencies representing approximately 588,000 worksites throughout the United States. Statistics derived from the CES survey are monthly estimates of employment, hours, and earnings for the nation, states, and major metropolitan areas. The CES includes only nonfarm workers and estimates current nonfarm employment at 150.3 million. Also, the CES does not address the Unemployed or Not-in-Labor-Force categories.
- Due to the nature and target audience of the CPS and CES, these surveys exclude the nonemployer workforce (i.e., a single-person business without paid employees). Per the Census Bureau’s Nonemployer Statistics website (an obscure federal site dedicated to nonemployer statistics), “due to their small economic impact, these (nonemployers) firms are excluded from most other Census Bureau business statistics.”
As opposed to surveys, like the CPS and CES, nonemployer statistics data originate chiefly from administrative records of the Internal Revenue Service, Bureau of Labor Statistics, and the Social Security Administration. These data undergo complex processing, editing, and analytical review at the Census Bureau to distinguish nonemployers from employers, correct and complete data items, and form the final nonemployer universe.[8]
Today, 24.8 million single-person nonemployer establishments employ approximately one-fifth as many employees who work for private sector employer establishments. Nonemployer firms also constitute about 80% of all small businesses in America[9] and have an economic impact of $1.0 trillion per year, which exceeds the economic impact of over half of the leading industrial sectors including Educational Services, Accommodation & Food Services, and Transportation & Warehousing. Jobenomics asserts that it is wrongheaded for the U.S. government to take the position that nonemployers have a minor economic impact and that the nonemployer workforce is virtually invisible in American policy-making. Furthermore, it is amazingly difficult to understand why policy-makers ignore the fact the nonemployer workforce is growing significantly faster than wage and salaried employees that work for employer businesses
The BLS monthly Employment Situational Summary[10] uses CPS and CES data. The monthly BLS Employment Situational Summary is a widely read government report used for policy-making in the United States. It is important to recognize that most BLS reports focused on standard workers who are employed by nonfarm, industry-centric and employer-providing firms. Agricultural (farms and ranches), nonstandard (contingent) and nonemployer enterprise worker data are sparse and episodic due to historical precedent, budgetary constraints and the nature of survey questions.
BLS Framework of the U.S. Civilian Population
Source: BLS, Table A-1. Employment Status of the Civilian Population12F13F[11]
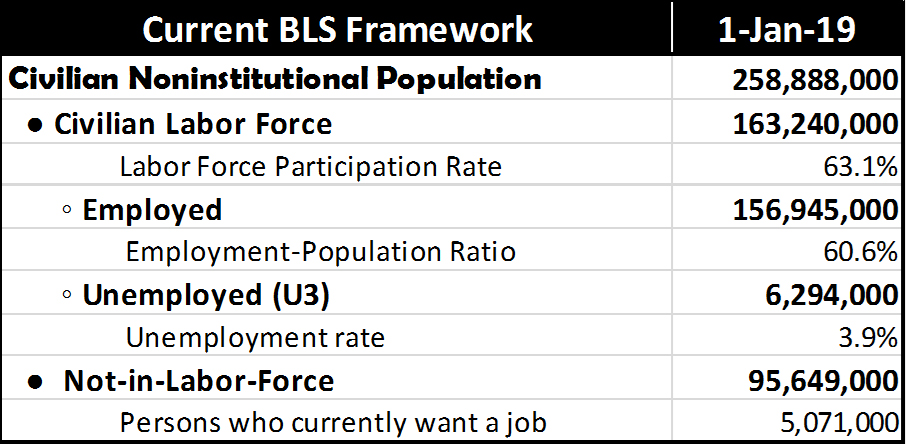
The BLS Employment Situational Report’s focal point is on the “Civilian Noninstitutional Population” that consists of three main categories (“Employed,” “U3 Unemployed” and “Not-in-Labor-Force”). As of 1 January 2019, the Civilian Noninstitutional Population was 258,888,000, which equates to 79% of the U.S. population.
The Civilian Noninstitutional Population consists of labor force data garnished from the U.S. Census Bureau for all citizens 16 years of age and older residing in the 50 States and the District of Columbia, who are not inmates of institutions (penal, mental facilities, homes for the aged) and who are not on active duty in the Armed Forces. The Civilian Labor Force includes only persons classified as Employed and Unemployed actively seeking work. The Not-in-Labor-Force category includes unemployed citizens who are not looking for work.
The Civilian Labor Force is 163,240,000, which includes 156,945,000 Employed and 6,294,000 Unemployed citizens. The official Unemployment Rate of 3.9% is obtained monthly by dividing the number of the U3 category of unemployed citizens by the number of the civilian labor force. The official Unemployment Rate is a rather misleading figure since it does not include the number of sidelined citizens in the Not-in-Labor-Force who are also unemployed.
The Not-in-Labor-Force contains 95,649,000 people who can work but are not working due to a wide range of circumstances from being temporarily ill to dependency on public assistance to going to school. If one calculated the official unemployment rate by dividing the total number of people capable of working (the number of U3 unemployed plus the number of citizens assigned to the Not-in-Labor-Force) by the Civilian Noninstitutional Population (as opposed to the Civilian Labor Force) the “functional” unemployment rate would be 39%, which is significantly higher than the official U3 Unemployment rate of 3.9%.
Unemployment Rate & Not-in-Labor-Force Categories
Jobenomics contends that all Americans who can work but don’t work, regardless if they are looking or not, should be considered “Functionally Unemployed.” Jobenomics defines “Functional” as being capable of operating or working. An adult who is capable of working but chooses not to work should be considered unemployed for the same reason that “discouraged,” “marginally attached” and “part-time workers for economic reasons” are included in the BLS’ U4, U5, and U6 categories.
Jobenomics further contends that unemployment rates should be reported as a percentage of the entire population as opposed to the Civilian Labor Force, which is a somewhat arbitrary number based on the willingness to work or look for work. If calculated against the entire U.S. population21F, the combined U3 unemployment and Not-in-Labor-Force rate would be 31%, which is still significantly higher than the official U3 Unemployment rate of 3.9%.
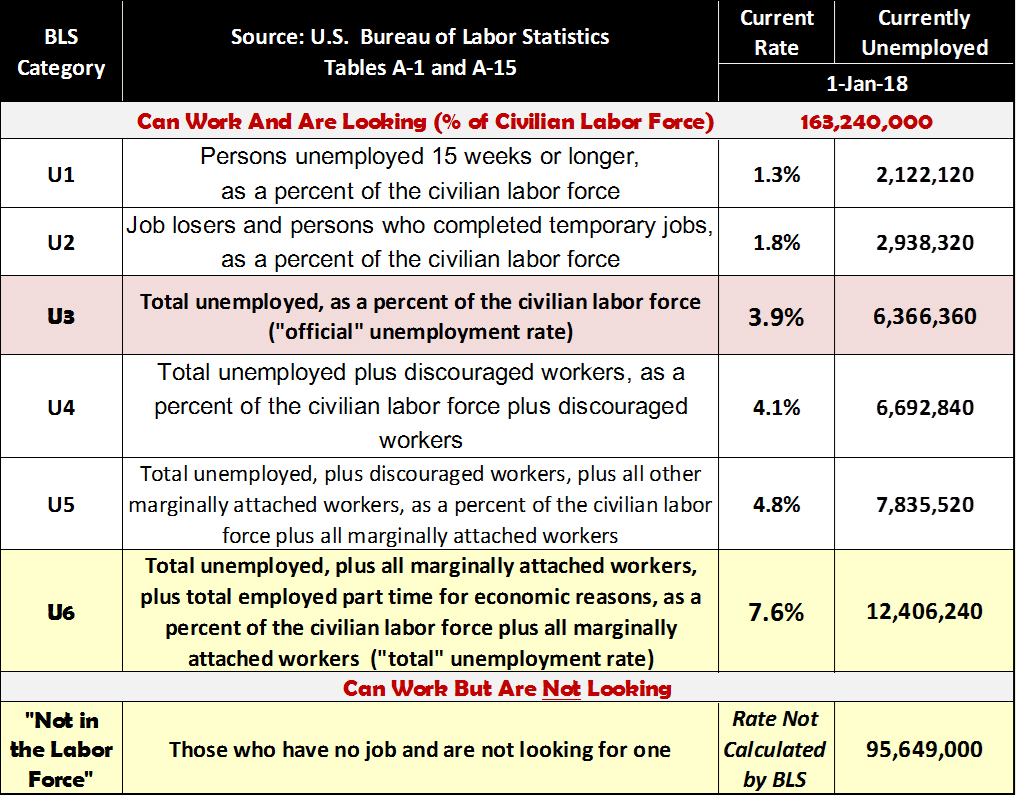
Six Unemployment categories (from U1 Long-Term Unemployed to U3 Officially Unemployed to U6 Total Unemployed and Underemployed) are reported monthly by the BLS.13F14F[12] Each Unemployment category requires that an individual must be actively looking for work. These categories are calculated as a percent of the Civilian Labor Force. The BLS also estimates the number of adults that can work but are not looking for work in a category entitled Not-in-Labor-Force.
Americans tend to overemphasize one statistic—the U3 rate or “official” unemployment rate (highlighted in red above). The Not-in-Labor-Force category is almost never mentioned in the media or used in policy-making, which is wrongheaded from both labor force and economic perspectives.
The Not-in-Labor-Force (95,649,000) is 15-times the size of U3 Unemployed (6,366,360) and exerts much higher strain on the U.S. economy and labor force. Additionally, Not-in-Labor-Force citizens tend to remain unemployed much longer—often for life. 95% of the Not-in-Labor-Force BLS survey respondents say that they “do not want a job now.”14F15F[13]
From a Jobenomics perspective, the BLS should include the Not-in-Labor-Force as one of the six unemployment categories in the same way that the lists marginalized and underemployed citizens in the U6 group. The determinant of whether a person is unemployed should not depend on subjective, and often whimsical, survey questions used to appraise people’s employment intentions.
The four BLS survey questions that government interviewers use to record a person as unemployed include (the bolded words are emphasized when read by the interviewers): 15F16F[14]
- Do you currently want a job, either full or part-time?
- What is the main reason you were not looking for work during the last 4 weeks?
- Did you look for work at any time during the last 12 months?
- Last week, could you have started a job if one had been offered?”
If a respondent answers “yes” to all four questions, that person is considered Unemployed. If the respondent answers “no” to any question, that person is assigned to the Not-in-Labor-Force.
Evaluating whether a person wants to work rather than the ability to work is like treating a symptom rather than the disease. Sooner or later, the American people will figure out that the current way our government calculates unemployment is seriously flawed. Under the current BLS system, it is theoretically possible for the United States to have a zero rate of unemployment while simultaneously having zero people employed in the labor force if all unemployed people just quit looking for work and joined those in the Not-in-Labor-Force. In other words, if all respondents answer “no” to one of the four BLS survey questions, the United States can have an instantaneous zero rate of unemployment.
The Current Population Survey (CPS) and its Annual Social and Economic Supplement (ASEC) provide limited insight into why people are not in the labor force.
During the bi-annual CPS ASEC survey, people who did not work at all in the previous year are asked to give the main reason they did not work. According to the BLS, “Interviewers categorize survey participants’ verbatim responses into the following categories: ill health or disabled; retired; home responsibilities; going to school; could not find work; and other reasons.”17F18F[15]
Since the BLS is primarily interested in whether people are working or looking for work, they do not ask why people are not seeking a job. “Our survey is designed to measure work and looking for work,” said Karen Kosanovich, a BLS economist. “We do not focus on people outside of the labor market.”18F19F[16] One should not perceive Kosanovich’s comment as trite but as factual. The BLS was established in 1884 during the advent of the Industrial Revolution to collect information on labor employment and government attention on why people are not working has changed little since then.
Not-in-Labor-Force Growth
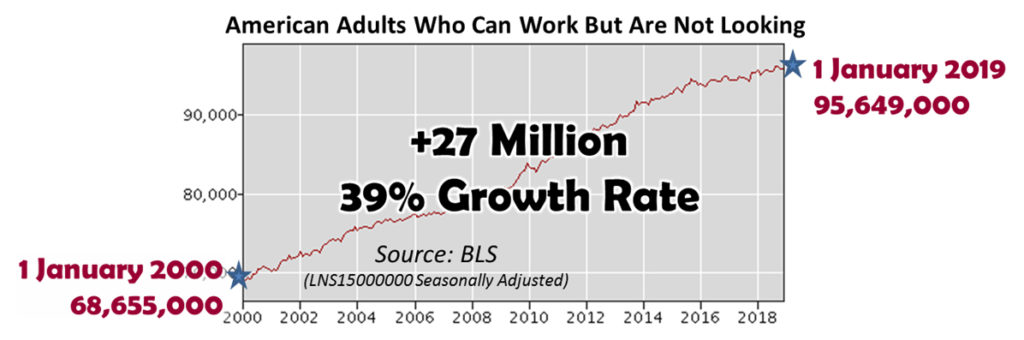
The explosive growth of people in the Not-in-Labor-Force Category is the most daunting challenge facing American policy-makers and the American public. According to BLS data20F20F[17], those in the Not-in-Labor-Force category (those that can work but don’t) has surged consistently since the year 2000 by 26,994,000 people, a growth rate of 39%. Woefully, little is being done to address this problem.
Not-in-Labor-Force Demographics
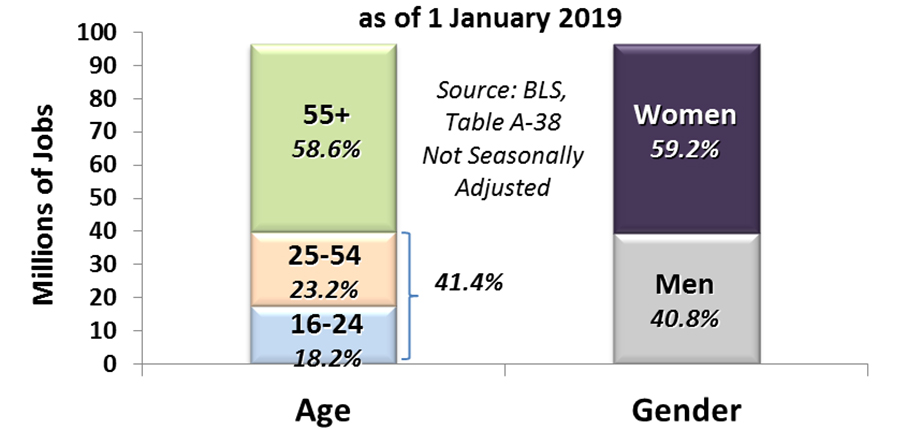
Older and female Americans—two groups of citizens critically important to a growing economy and a vibrant labor force—represent almost 60% of the citizens in the Not-in-Labor-Force category. As shown, the Not-in-Labor-Force includes 56 million people 55 years+ (58.6%), 22 million 25-to-54-year-old “working age” Americans (23.2%), and 18 million 16-to-24-year-olds (18.2%). Regarding gender, the Not-in-Labor-Force includes 57 million women (59.2%) and 39 million men (40.8%).
In conclusion, U.S. policy-makers and decision-leaders must shift their attention from focusing on historically low U3 unemployment rates to understanding the reasons that Not-in-Labor-Force Americans no longer look for work. Failure to do this in 2019 will result in a less sustainable economy and a weaker labor force. Jobenomics would not eliminate the old U-rate system but would create a complementary metric based on population and the capability to work. By focusing on functional unemployment (U6 and Not-in-Labor-Force), as opposed to U3 unemployment, the American public would have a greater understanding of government statistics. Equally important, policy-makers could make better decisions regarding the labor force, tax revenue generation and entitlement/welfare expenditures.
About Jobenomics
Jobenomics concentrates on the economics of business and job creation. The non-partisan Jobenomics National Grassroots Movement’s goal is to facilitate an environment that will create 20 million net new middle-class U.S. jobs within a decade. The Movement has reached an estimated audience of 30 million people. The Jobenomics website contains numerous books and material on how to mass-produce small business and jobs as well as valuable content on economic and industry trends. For more information see Jobenomics.com.
[1] United States Department of Agriculture, Economic Research Service, Ag and Food Sectors and the Economy, https://www.ers.usda.gov/data-products/ag-and-food-statistics-charting-the-essentials/ag-and-food-sectors-and-the-economy.aspx
[2] The BLS has two monthly surveys that measure employment levels and trends: the Current Population Survey (CPS), also known as the household survey, and the Current Employment Statistics (CES) survey, known as the payroll or establishment survey. CPS and CES estimates have distinct employment definitions and methods. Generally speaking, the CES estimates approximately 7 million fewer employees than the CPS since CES data excludes agriculture and related employment, the unincorporated self-employed, unpaid family and private household workers and workers absent without pay from their jobs. Both surveys include only civilian employees in Government employment and exclude uniformed members of the armed services. http://www.bls.gov/web/empsit/ces_cps_trends.pdf
[3] U.S. Bureau of Labor Statistics, Employment Situation Summary, https://www.bls.gov/news.release/empsit.nr0.htm
[4] U.S. Bureau of Labor Statistics, Household Data, Summary table A. Household data, seasonally adjusted, https://www.bls.gov/news.release/empsit.a.htm
[5] U.S. Census Bureau, U.S. and World Population Clock, https://www.census.gov/popclock/
[6] Pew Research Center, The American Middle Class Is Losing Ground, No Longer The Majority and Falling Behind Financially, 9 December 2016, http://www.pewsocialtrends.org/files/2015/12/2015-12-09_middle-class_FINAL-report.pdf
[7] U.S. Bureau of Labor Statistics, Household vs. Establishment Series, http://www.bls.gov/lau/lauhvse.htm#hvse
[8] U.S. Census Bureau, Nonemployer Statistics, 2018, https://www.census.gov/quickfacts/fact/note/US/NES010216
[9] U.S. Small Business Association, Office of Advocacy, Frequently Asked Questions, https://www.sba.gov/sites/default/files/advocacy/Frequently-Asked-Questions-Small-Business-2018.pdf
[10] U.S. Bureau of Labor Statistics, Employment Situation Summary, https://www.bls.gov/news.release/empsit.nr0.htm
[11] BLS, Table A-1, Employment status of the civilian noninstitutional population 16 years and over, 1981 to date, http://www.bls.gov/web/empsit/cpseea01.htm
[12] BLS, Table A-15, Alternative measures of labor utilization, http://www.bls.gov/news.release/empsit.t15.htm
[13] BLS, Table A-1. Employment status of the civilian population by sex and age, http://www.bls.gov/webapps/legacy/cpsatab1.htm
[14] BLS, Who is not in the labor force?, http://www.bls.gov/cps/cps_htgm.htm#nilf
[15] BLS, Beyond the Numbers, People who are not in the labor force: why aren’t they working?, December 2015, http://www.bls.gov/opub/btn/volume-4/people-who-are-not-in-the-labor-force-why-arent-they-working.htm
[16] Washington Post, 16 September 2016, https://www.washingtonpost.com/news/fact-checker/wp/2016/09/16/trumps-absurb-claim-that-92-million-americans-represent-a-nation-of-jobless-americans/
[17] BLS, Table A-16, Persons not in the labor force and multiple jobholders by sex, not seasonally adjusted, http://www.bls.gov/webapps/legacy/cpsatab16.htm

