
The five-week (22 December 2018 to 25 January 2019) partial government shutdown dominated the headlines in December and January. Many of these headlines predicted that the U.S. could experience zero economic growth in the first quarter of 2019. As a result of this onerous prediction and other worrisome prognostications, the world held its breath to see if the contagion would spread. The federal government reopened all of its doors on 25 January 2019, and the world turned its attention to other weighty matters. Instead of averting its focus, the American news media capitalized on a Congressional Budget Office (CBO) statistic that fourth-quarter U.S. gross domestic product (GDP) was reduced by a “massive” $3 billion due the government shutdown. While $3 billion is a headline grabber, it is trivial compared to a GDP of $20,658 billion.[1]
A post-shutdown CBO analysis, entitled “The Effects of the Partial Shutdown Ending in January 2019” stated that real (inflation-adjusted) GDP in the fourth quarter of 2018 was reduced by $3 billion to what it would have been if the federal government had remained open. The CBO report also predicted that the level of economic impact in the first-quarter of 2019 could be as high as $8 billion.[2] Based on these highly-advertised figures, many Americans feared that the U.S. economy and labor force were facing a situation of great peril. Fortunately, this fear was unfounded. As of 1 February 2019, the economy and workforce are doing just fine.
Most media outlets gauge the health of the U.S. economy on stock market performance. At the onset of the partial government shutdown, many media-pundits lamented that America should prepare for a massive market downturn. Surprisingly, U.S. stocks soared upward, and the U.S. stock market had its best January in 30-years.[3] Since January historically has been a barometer for the rest of the year, future stock market performance could be even better now that the partial government shutdown is over.
According to the U.S. Bureau of Labor Statistics (BLS), the U.S. labor force also had a great January gaining 304,000 new jobs—the second highest amount in the 25-month tenure of the Trump Administration and the ninth highest number during the 115 months since the end of the Great Recession.[4] Per the BLS, federal workers on leave during the shutdown were considered employed since they will receive pay. Other workers, including federal contractors, who did not work or receive payment, were counted as unemployed, which contributed to an uptick of the unemployment rate from 3.9% to 4.0% for an increase of 241,000 unemployed Americans.[5]
Part 4 of this Year Ahead series, entitled “Understanding Employment Statistics,” stressed the importance of understanding how the U.S. federal government evaluates the U.S. labor force. Basic knowledge of government statistical surveys is essential to understanding the meanings behind the numbers and interpreting fact from spin and fake news.
The BLS uses two monthly Census Bureau surveys that measure employment levels and trends. The more extensive analysis of 160,000 nonfarm businesses with paid employees (excluding the self-employed and nonemployer businesses) and government agencies is the Current Employment Statistics (CES) survey, also known as the payroll or establishment survey. The Current Population Survey (CPS), known as the household survey, is random sample survey of approximately 60,000 households that includes the self-employed, farm and ranch workers, private household workers and workers on leave without pay.[6]
CPS and CES estimates have distinct employment definitions and methods. The CES is designed to measure employment, hours, and earnings with significant “industrial and geographic” detail. The CPS is designed to measure employment and unemployment with significant “demographic” detail. Generally speaking, the CES estimates approximately 7 million fewer employees than the CPS since the CES excludes agriculture and related employment, the self-employed, household workers and workers absent without pay from their jobs. Since the CPS covers a broader range of employment categories outside employer businesses, it presents a more accurate picture of the impact of the shutdown on the labor force.
These charts show the difference between the CES (Establishment/Payroll Survey) and the CPS (Household Survey).
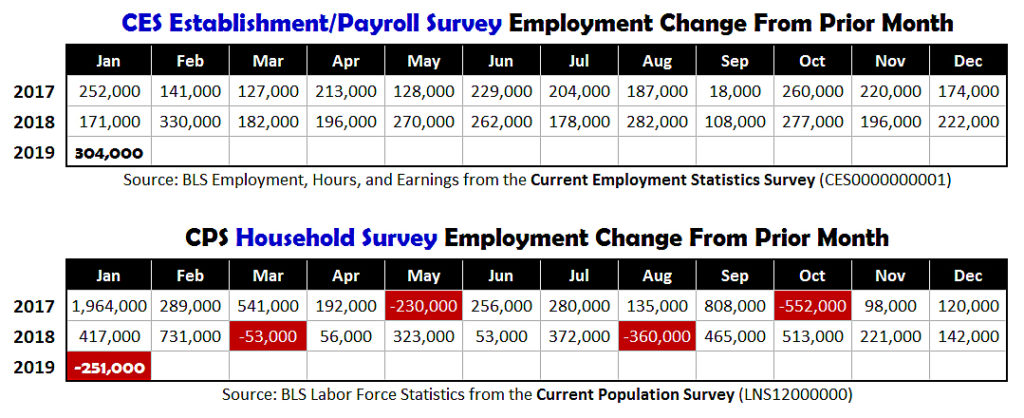
As shown, per the CES, business establishments with paid employees hired a near record-breaking number (304,000) of workers that extended the Trump Administration’s consecutive run of workforce gains to 25-months. On the other hand, the CPS tells a slightly different story of 20-months of workforce gains and 5-months of workforce losses. In January 2019, the CPS reported a loss of 251,000 workers, which reflects the impact of 241,000 more unemployed Americans.
In summary, in spite of the historic 5-week sabbatical of 800,000 government workers, the outlook for U.S. economic and labor force growth in 2019 remains positive. While the government closure created a great deal of inconvenience and anxiety for furloughed workers, these civil servants are now receiving back pay that will boost economic performance in future months. According to the CBO, except for an unrecoverable $3 billion, U.S. GDP will be temporarily higher in subsequent quarters than it would have been in the absence of a shutdown. Furthermore, per the CBO, the level of economic impact of sidelining almost one million workers (including private sector government contractors) will only reduce U.S. GDP in 2019 by an inconsequential amount of “0.02%”.
Download, at no cost, this posting, other Year Ahead postings and a wide variety of Jobenomics economic, community, business, and workforce development documents in the Jobenomics Library.
Jobenomics concentrates on the economics of business and job creation. The non-partisan Jobenomics National Grassroots Movement’s goal is to facilitate an environment that will create 20 million net new middle-class U.S. jobs within a decade. The Movement has reached an estimated audience of 30 million people via lectures, social media, and the Jobenomics America TV show. The Jobenomics.com website contains numerous books and material on how to mass-produce small business and jobs as well as valuable content on economic and industry trends. For more information see Jobenomics.com.
[1] U.S. Bureau of Economic Analysis, National Income and Product Accounts, Table 1.1.5, Gross Domestic Product, Last Revised on: December 21, 2018 – Next Release Date January 30, 2019, https://apps.bea.gov/iTable/iTable.cfm?reqid=19&step=2#reqid=19&step=2&isuri=1&1921=survey
[2] Congressional Budget Office, The Effects of the Partial Shutdown Ending in January 2019, January 2019, https://www.cbo.gov/publication/54937
[3] The Wall Street Journal, U.S. Stocks Post Best January in 30 Years, Gains by banks and small caps helped lift the Dow and S&P 500 to their best starts since the 1980s, 31 January 2019, https://www.wsj.com/articles/resilient-u-s-economy-fuels-january-stock-market-recovery-11548939600
[4] U.S. Bureau of Labor Statistics, Employment Situation Summary, 1 February 2019, https://www.bls.gov/news.release/empsit.nr0.htm
[5] U.S. Bureau of Labor Statistics, Table A-10. Selected unemployment indicators, seasonally adjusted, https://www.bls.gov/webapps/legacy/cpsatab10.htm
[6] U.S. Bureau of Labor Statistics, Understanding the employment measures from the CPS and CES survey, https://www.bls.gov/opub/mlr/2006/02/art2full.pdf

