Quoting the book entitled Start-Up Nation, “How is it that Israel—a country of 7.1 million, only 60 years old, surrounded by enemies, in a constant state of war since its founding, with no natural resources—produces more start-up companies than large, peaceful, and stable nations like Japan, China, India, Korea, Canada, and the UK?” The answer is because they need to prosper and survive. Quoting Jobenomics’ e-book entitled China’s Digital Economy Quest, “As China has proven, small business creation provides for income opportunity and wealth creation for many hundreds of million people.  Over the last two decades, the Chinese have been able to lift 700 million people out of poverty. China is now mastering the emerging digital economy to elevate hundreds of millions of rural poor from poverty. China’s transition from a physical (mainly manufacturing) economy to a digital economy is both rapid and impressive. Jobenomics contends that China’s unified vision and public-private partnership is more mature and competitive than the United States’ business-as-usual approach to small business and job creation.”
|
Download, at no cost, this posting, other Year Ahead postings and Jobenomics economic, business, and workforce development documents in the Jobenomics Library. |
Small business is the engine of the U.S. economy—an engine that employs the vast majority of Americans and produces the vast majority of new jobs not only this decade but in decades prior. Business startups are the seed corn of the U.S. economy. Without planting and fertilization of these seedlings and nourishing and promoting small and micro businesses, the fields of American commerce will erode. While the U.S. economy is currently booming, small, micro and startup businesses are faltering, placing economic and labor force growth in jeopardy in today’s global marketplace.
After meeting with literally thousands of policy-makers, decision-leaders, and business executives over the last decade, this author is amazed how little they appreciate and support the American small, micro and startup businesses community and their vital contribution to job creation and overall economic health. For some obscure reason, policy-makers and media-pundits focus on big business and turn a blind eye to small firms that employ 77.1% of all Americans and created 73.7% of all new jobs as of 1 February 2019.
The common perception is that while small businesses play a significant role in job creation their contribution to net job creation is limited since half of all startups fail within the first five years. As this report will address, with proper planting, fertilizing, nurturing and support, the lifespans of this indispensable business community can be extended, new births generated and high-impact titans created (e.g., Walmart 1962, Apple 1976, Amazon 1994, Tesla 2003, Facebook 2004 and Uber 2009).
According to a 2011 Small Business Administration report, “If the U.S. is confronting a job generation problem and if there is a class of companies known to account for nearly all net job creation…this unique class of firms is ‘high impact companies.’ There are, on average, about 350,000 high impact companies in the U.S., representing about 6.3 percent of all companies in the economy. These companies are younger and more productive than all other firms and are found in relatively equal shares across all industries, even declining and stagnant ones. They generate all net jobs in the economy and their job creation capacity is largely immune from the expansions and contractions of the business cycle.”[1]
A more recent December 2018 report by the Congressional Research Service reaffirms that “net job creation is concentrated among a relatively small group of surviving ‘high-impact’ (startups, young small) businesses that are younger and smaller than the typical business.” [2]
Unfortunately, both U.S. small business and startup businesses are faltering. American policy-makers and corporate-leaders do little to energize the small business community and promote American entrepreneurism that is at the heart of small business creation. Instead, government policies rely on big business for job creation. These policies are not likely to bear much fruit. In today’s highly competitive global environment, most large corporations are reducing their labor force by outsourcing work to U.S. contingent workers and foreign entities, and automating routine manual and cognitive tasks via the revolution in network and digital technologies.
Kauffman Foundation’s 2018 State of Entrepreneurship report states that American entrepreneurs are “very optimistic” about their business and the potential for future growth. On the other hand, entrepreneurs reported that they underestimated the “struggles” associated with the technical aspects of starting their businesses. Moreover, they were frustrated by the lack of support from the public and established private sector institutions.
According to the Kauffman report, “These entrepreneurs say the government isn’t supporting them as they seek to open or grow their businesses. The government resources that are available to them aren’t the ones they need, and many feel that the government supports established businesses over their own.” 79% of surveyed startup owners felt that they had little government support to start their business. 92% felt that President Trump and Congress should spend more time working to help startup businesses.[3]
Small Business Statistics and Trends
The U.S. Small Business Association (SBA) defines a small business as an independent establishment having fewer than 500 employees. In 2015 (latest SBA data), compared to 19.4 thousand large firms, there were 30.2 million small businesses, of which 24.3 million were nonemployer businesses that had no employees and 5.9 million small businesses with paid employees. Policy-makers expend a considerable amount of time and political capital on large corporations, little time and effort supporting small employer businesses, and virtually no time on nonemployers.[4]
It is essential to understand that different organizations define “small “differently. For example, many international organizations, such as the Canadian government, categorizes small businesses as having 1-100 employees. The ADP National Employment Report, the other major U.S. monthly employment report, denotes establishments with 1-49 employees as small, 50-499 employees as a medium-sized company, and 500+ employees as a large firm. Furthermore, most organizations exclude nonemployer businesses that are single-person owned businesses without paid employees.[5] Since Jobenomics concentrates on mass-producing small, micro, startup and nonemployer business, we generally define small as 1-499 (per the SBA’s definition), and the micro-business category as 1-19 paid employees, startups as predominantly micro and nonemployer firms that are less than 1-year old, and nonemployers as 1 nonpaid employee (i.e., the owner or proprietor).
The ADP National Employment Report is a monthly survey of workers in 400,000 U.S. private sector businesses by the ADP Research Institute in collaboration with Moody’s Analytics. [6] Jobenomics uses ADP data since it provides greater insight into the small and micro business situation than the BLS that is more focused on large industrial supersector trends and statistics.
Employment Growth by Company Size since the Start of the Great Recession
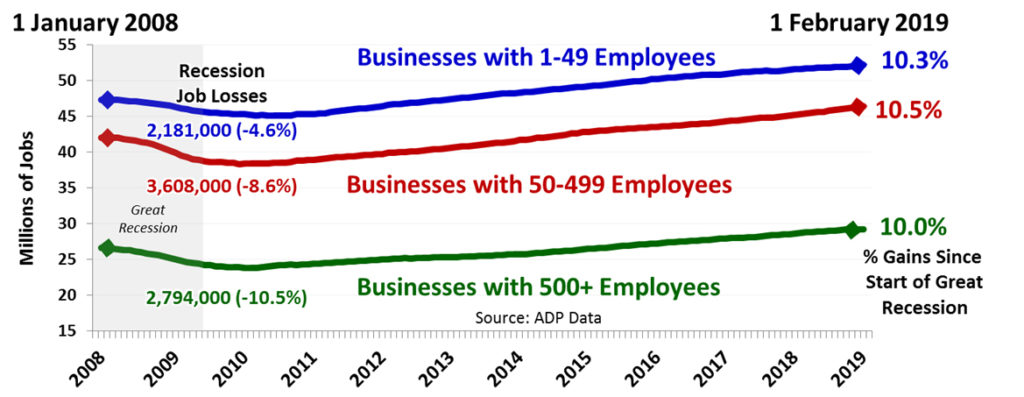
According to the ADP National Employment Report, as shown above, medium-sized and large corporations suffered greater downturns during the recession and slower recoveries than their small business counterparts. Major companies downsize rapidly during adverse financial times, whereas small firms have to keep their doors open to stay in business.
U.S. Private Sector Employment by Company Size
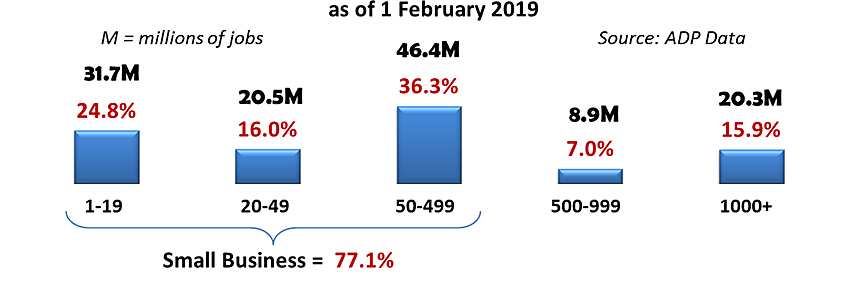
As reported by ADP, small businesses are undeniably the dominant employer in the United States. Small companies with less than 500 employees employ 77.1% of all private sector Americans with a total of 98,631,000 employees—3.4-times the number of enterprises with more than 500 employees that have 29,272,000 employees. Micro-businesses with 1-19 employees employ 1.6-times the number of jobs than firms with over 1,000 employees (31,695,000 versus 20,340,000).
U.S. Private Sector Jobs Created This Decade by Company Size

Since the beginning of this decade, small businesses created 73.7% of all new jobs in the United States. Small businesses with less than 500 employees created 2.8-times more jobs as large businesses with 500+ employees, or 15,237,000 versus 5,430,000 new jobs respectively. Micro and self-employed firms with 1-19 employees produced 89% as many jobs as large-scale corporations with over 1,000 employees (3,403,000 versus 3,810,000).
U.S. Private Sector Jobs Created Last Month by Company Size
Last month (January 2019), U.S. small business (1-499 employees) created 69.2% of all new jobs. This percentage is slightly below the 70.2% average during the Trump Administration. The monthly low was 16.9% in September 2017. The monthly high was 93.6% in April 2017.
GDP versus Job Growth by Company Size This Decade (2010-2019)
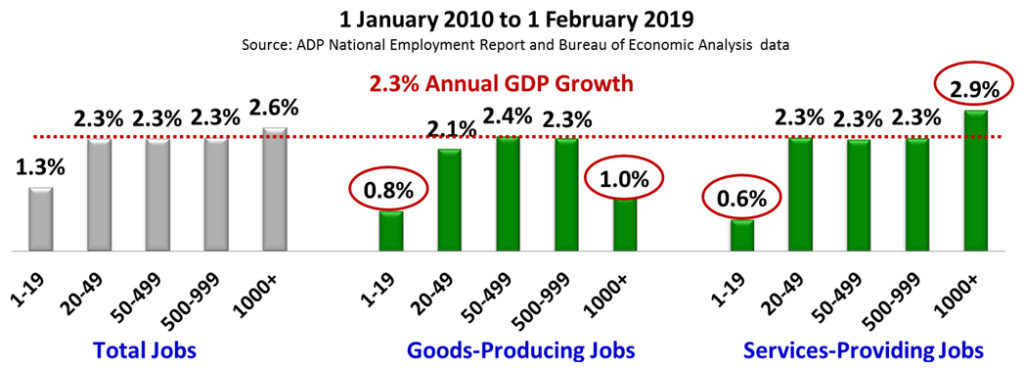
Regarding job growth, only very large (1000+ employee) service-providing companies performed better (2.9%) than average annual GDP growth (2.3%) from 1 January 2010 to 1 February 2019.
Big (1000+ employees) goods-producing corporations (mainly manufacturing) grew at only 1.0% this decade. However, President Trump’s manufacturing emphasis is beginning to bear fruit with overall manufacturing growth at 4.0% during 2017 and 2018. The year 2019 should be even better since most of the U.S. major trading partners have agreed to more equable trade agreements. China, responsible for half of the U.S. trade deficit in both 2017 and 2018 through October, is the last major holdout but will eventually agree to a compromise that will be more balanced. If this happens, 2019 should be an outstanding year for most U.S. industries. If China doesn’t, 2019 could be bad for business.
Micro-businesses grew between 0.6% and 0.8% which is significantly less than GDP growth. Other than a few unicorns (a startup company valued at over $1 billion) and gazelles (a high-growth company that has been increasing its revenues by at least 20% annually for four years or more starting from a revenue base of at least $100,000), the U.S. business engine is faltering, and business startups dropped to 30-year lows.
Faltering Small and Micro Businesses
Unfortunately for the U.S. economy and labor force, the American small and micro business engines are faltering, and big business is not making up for the difference in job creation.
Small versus Large Business Performance from 2006 to 2019
Number of New Jobs Created or Loss Compared to Previous Year’s Level of Employment
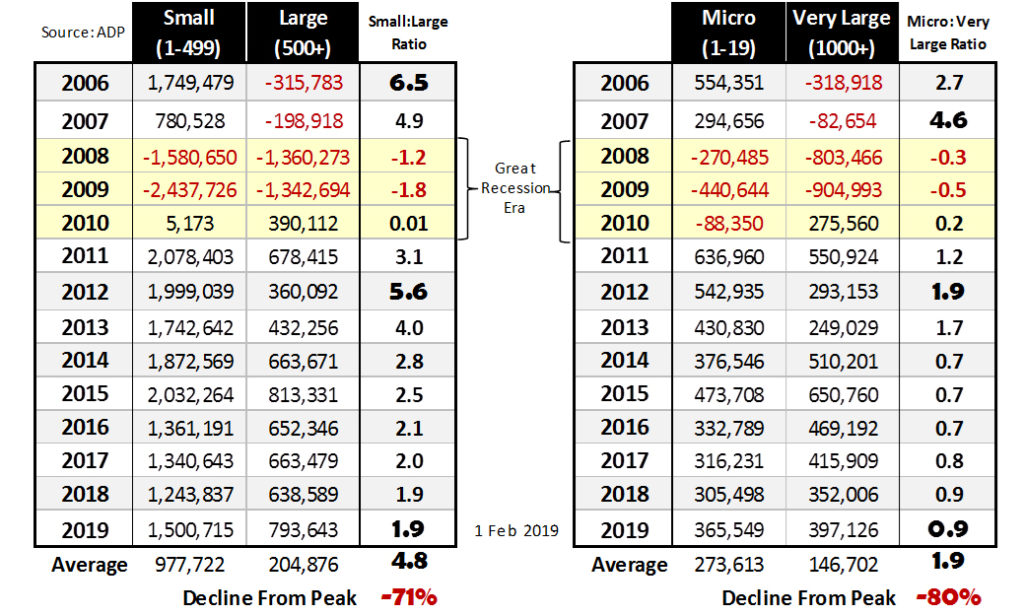
This table is derived from the ADP National Employment Report historical job creation data by company size covering the period from January 2006 to February 2019. The key takeaways from this table are:
- Before the Great Recession, small business (1-499 employees) outproduced large establishments (500+ employees) by a factor of5-to-1 in 2006. Micro-business (1-19 employees) outproduced very large businesses (1000+ employees) by a factor of 4.6-to-1 in 2007.
- As of 1 February 2019, the small-to-large business ratio dropped from its 2007 peak by -71% to 1.9-to-1. The micro-to-very-large business ratio fell from its 2006 peak by –80% to 0.9-to-1.
- In 2006-2007 before the Great Recession, small and micro establishments generated job gains, whereas large businesses shed jobs (mainly due to outsourcing overseas and investing capital gains in the stock markets rather than recapitalizing in the United States).
- During the Great Recession Era (2008 through 2010), small businesses lost approximately twice as many jobs compared to large businesses, 4,013,202 versus 2,312,855 respectively. Conversely, micro-businesses lost half (66,623) the number of jobs compared to very large corporations losses (119,408). Unsurprisingly, large and very large companies recovered more quickly in 2010 than their smaller counterparts.
- By 2012, the small business community rebounded, and its ratio reached a near peak pre-Great Recession level of 6-to-1. Then the decline began, and the small-large ratio plummeted steadily to its current low of 1.9-to-1. Reasons for this downturn are many. However, from a governance perspective, the Obama Administration focused on progressive social issues while the Trump Administration concentrated on very large (1000+) corporations that added fewer new jobs every year since the President took office. In January 2019, micro businesses added almost as many new jobs as large corporations, 365,549 versus 397,126 respectively,
- Unfortunately, micro-businesses never fully recovered after the Great Recession and are generating jobs well below their previous performance levels. If this trend is not reversed, economic and labor force growth in 2019 and subsequent years will be limited.
The other source for job creation data by company size comes from the Bureau of Labor Statistics’ Business Employment Dynamics (BDS) program that uses an entirely different methodology. An analysis of BDS data shows a similar decline in small and micro business job creation.
Small Business (1-499) Job Creation Engine Is Faltering
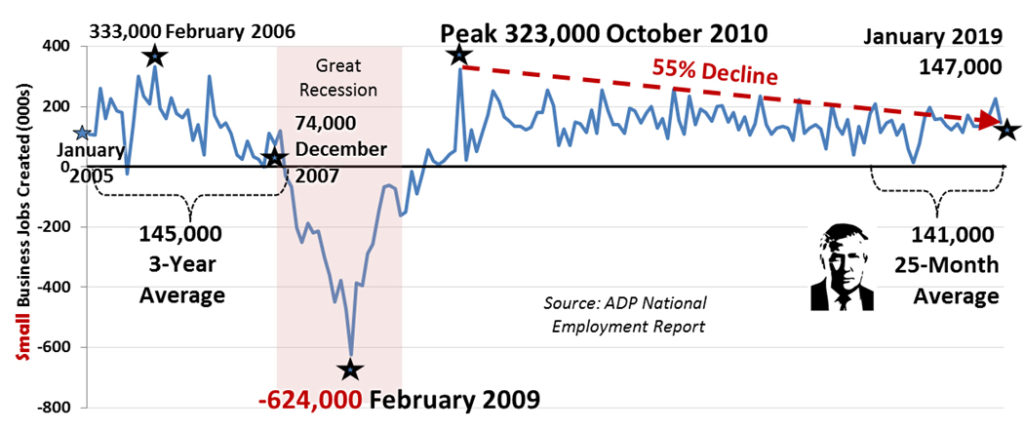
The small business (1-499 employees) 3-year average before the Great Recession was 145,000 jobs per month. President Trump’s small business average over the 25-months that he has been in office is 141,000 jobs per month.
During the depth of the Great Recession in February 2009, small businesses laid off 624,000 people in a single month, which is indicative of the hazards of a stalled small business engine. Twenty months later, the small business engine was hitting on all cylinders and generated a peak of 323,000 jobs in October 2010. Since this post-recession peak to today, small business job creation dropped 55% to 147,000 as of 1 February 2019, a difference of 176,000 jobs per month.
Consequently, over 120 months, a deficit of 176,000 monthly jobs equates to 21,120,000 fewer jobs per decade. The Trump Administration could use these lost small business jobs to fulfill the Presidents vision of 25 million new jobs over the next decade.
If the small business engine had a heart, it would be a micro-business. Most micro-businesses are self-employed firms (one-person incorporated or unincorporated), family businesses (mom-and-pops) or partnerships. Micro-firms are essential to local communities. They are the type of enterprises that hire the unemployed and give part-time jobs to high schoolers and other entry-level workers. Continued deterioration of micro-businesses can only lead to economic stagnation.
Micro-Business (1-19) Job Creation Engine Is Also Faltering
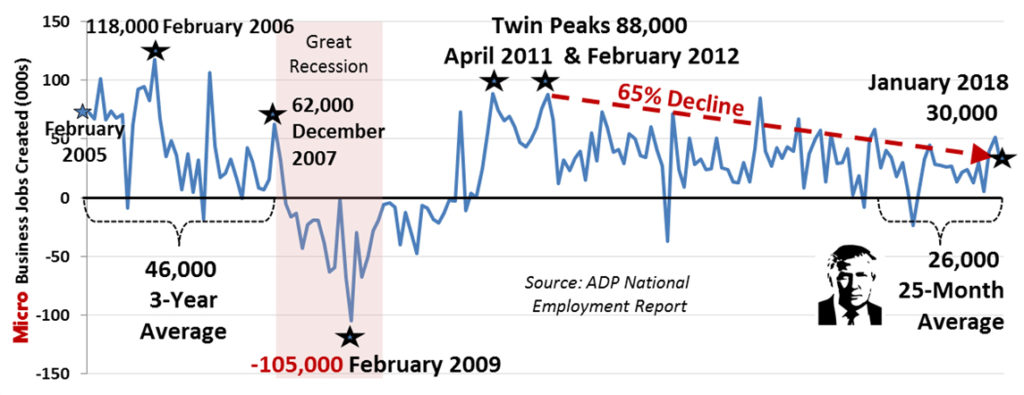
Sadly, the U.S. micro-business heart is suffering from a form of atherosclerosis as indicated by a significant decline since the twin post-recession peaks. Since the post-recession twin peaks in April 2011 and February 2012, micro-business job creation declined by 65%.
The average number of micro-business jobs created during the Trump Administration is 26,000 jobs per month, which is a meager number considering the relative strength of the U.S. economy and is 43% lower than the 3-year 46,000 jobs per month average before the Great Recession. Fortunately, micro-business is showing a revival over the last three months (39,000 in November 2018, 51,000 in December 2018 and 30,000 in January 2019).
Precipitous Decline in Startup Businesses
The rate of business startups is also falling precariously. Business startups are the seed corn of the U.S. economy. Without the planting and fertilization of these seedlings, the fields of American commerce will erode.
- Over the last 4-decades, the US trade deficit in goods amounted to an incredible $12.4 trillion—a vast sum equivalent to a loss of 248 million U.S. workers earning $50,000 per year, or roughly 6.2 million unrealized job gains (i.e., job losses) per year. For a detailed trade deficit analysis, see Part 7, Reciprocal versus Free Trade, this Year Ahead series.[7]
- In comparison, the degradation in new business starts equates to 76 million unrealized job gains over the last 4-decades or approximately 1.8 million lost job opportunities per year.
To substantiate the claim that the decline of U.S. business startups are a clear and present danger to the health of the U.S. economy and labor force, Jobenomics conducted an analysis of the U.S. Census Bureau’s Business Dynamics Statistics (BDS) database and the U.S. Bureau of Labor Statistics’ Business Employment Dynamics (BES) databases.[8] [9]
Declining Number Startup Business 1977 to 2014
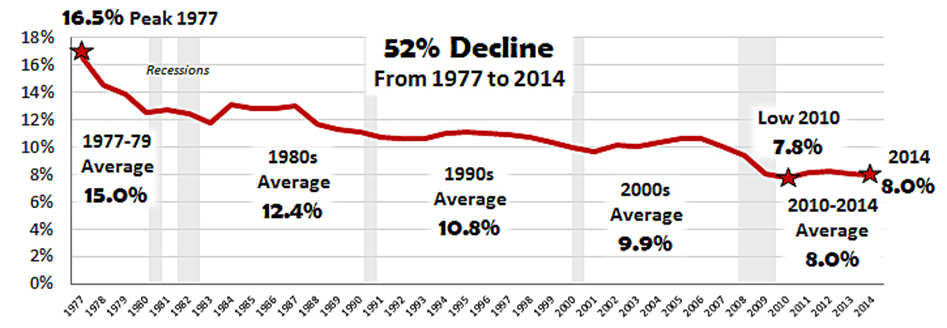
The latest Census Bureau’s Business Dynamics Statistics (BDS) database indicates the United States is now creating startup businesses (firms less than 1-year old) at historically low rates, down from 16.5% of all firms to 8% in 2014 (data range from 1977 to 2014). [10]
According to a September 2017 BDS Press Release[11], in 2015, 414,000 U.S. startup firms created 2.5 million new jobs, which is well below the pre-Great Recession average of 524,000 startup firms and 3.3 million new jobs per year for the period 2002-2006. In 2015, job creation minus job destruction equaled net job creation of 3.1 million, which supports the Jobenomics hypothesis that net job creation is a more critical statistic for policy-makers than just focusing on only new jobs.
Based on a Wall Street Journal (WSJ) analysis of BDS data, “If the U.S. were creating new firms at the same rate as in the 1980s…more than 200,000 companies and 1.8 million jobs a year” would have been created. [12] If correct, during the 42 years between 1977 and 2019, the U.S. labor force had unrealized job gains as high as 75,600,000 jobs.
To check the validity of this immense number, Jobenomics uses the Bureau of Labor Statistics’ Business Employment Dynamics (BES)[13] data from the Quarterly Census of Employment and Wages (QCEW) database.[14] QCEW data comes from summaries of employment and total wages of workers (government employer and private sector nonemployer businesses excluded) covered by state and federal unemployment insurance. These data enable users to compare gross job flows and net employment changes across a range of business organizations, from startups to small and young firms to large and older firms.
The BES provides insights into job flows by age and size at both “establishments” and “firms.”
- An establishment is an economic unit that produces goods or services, usually at a single location, and engages in one or mainly one activity. BLS identifies establishments by the unemployment insurance and reporting unit numbers.
- A firm is a legal business and may consist of one or several establishments. BLS uses the employer tax identification numbers (EIN) as a proxy firm identifier to determine the owners of establishments. For single establishments, firm and establishment characteristics are the same. [15]
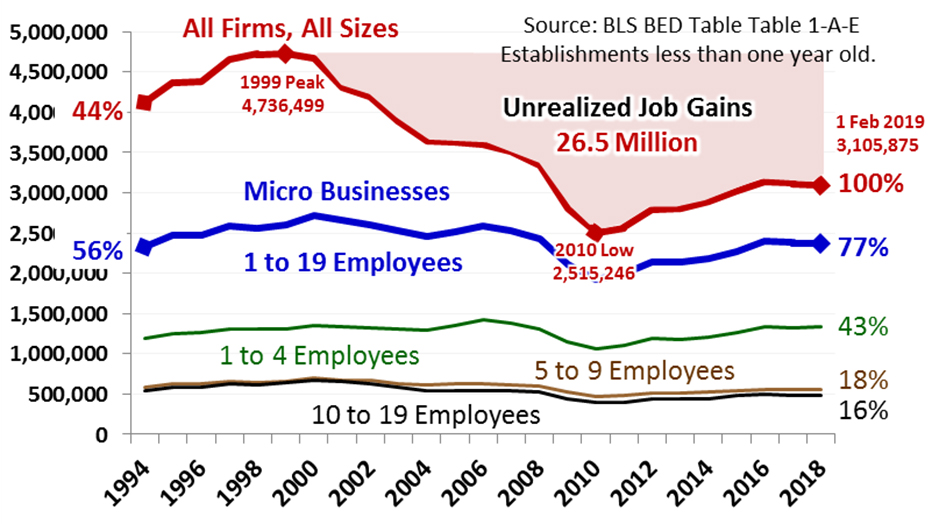
To establish gross job gains for startup businesses, Jobenomics uses data from BES Firm Table 1-A-F and BES Establishment Table 1-A-E on establishments less than one-year-old. [16] [17] Note, BES data is limited to the 25 years between 1994 through 2018.
According to the following analysis of BES data, during the 20 years from 1998 to 2019, the U.S. labor force had unrealized job gains as high as 37,895,624 jobs, which is slightly higher than the Census Bureau’s Business Dynamics Statistics (BDS) estimate of 75,600,000 unrealized job gains over a 42-year period between 1977 and 2019s.
Unadjusted (Actual) Unrealized Job Gains per Establishment
Adjusted (for Population Growth) Unrealized Job Gains per Establishment
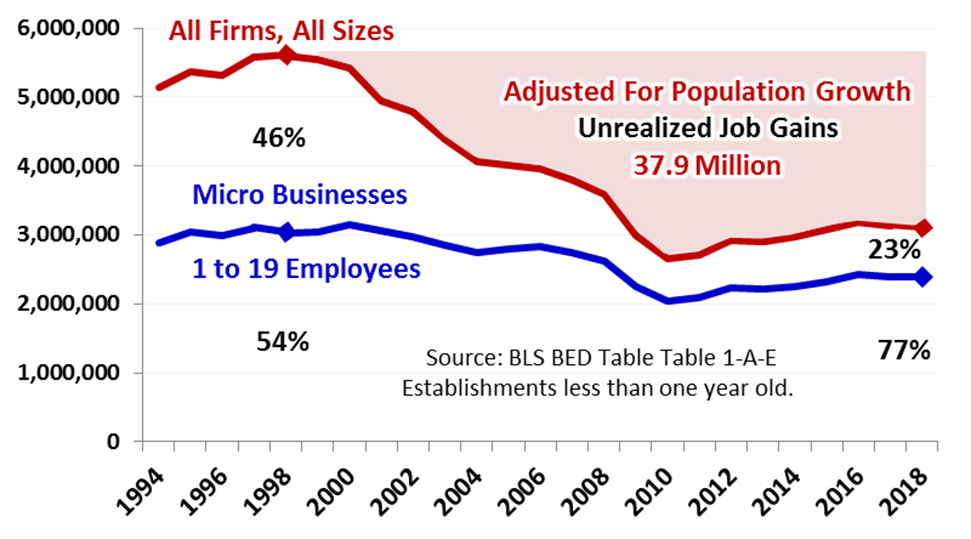
According to BES Establishment Table 1-A-E data, during the same period, unrealized job gains amounted to 26.5 million jobs, and adjusting for population gains, 37.9 million jobs. As shown on the Adjusted (Actual) chart, while micro-business starts remained around the 3 million per year level throughout this period, the percentage of micro-businesses of the total startup increased from 56% in 1994 to 77% by the end of 2018. While the BED program does not address the reasons why the large business percentage decreased, it is safe to assume that the focus is more international and making money on money (stock buybacks, mergers, acquisition, and secondary market investments) as opposed to startups and recapitalizing of existing businesses.
Unadjusted (Actual) Unrealized Job Gains per Firm
Adjusted (for Population Growth) Unrealized Job Gains per Firm
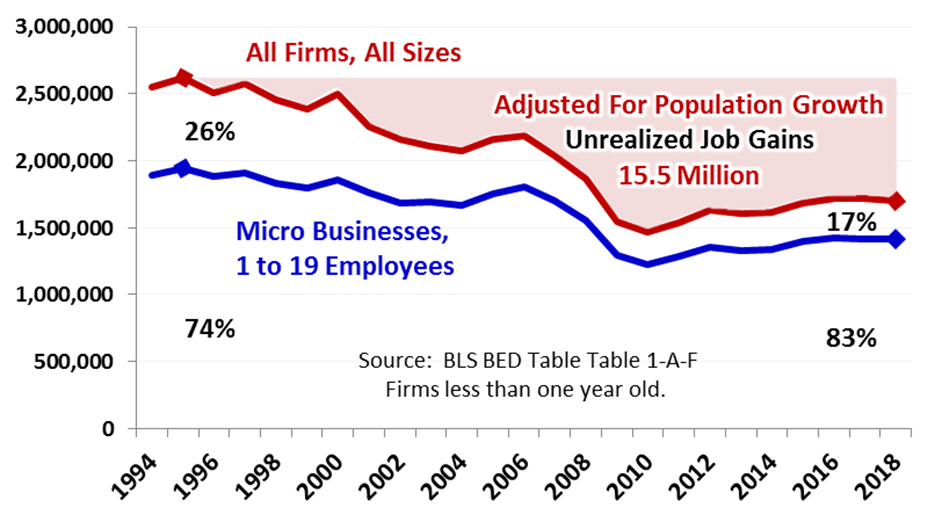
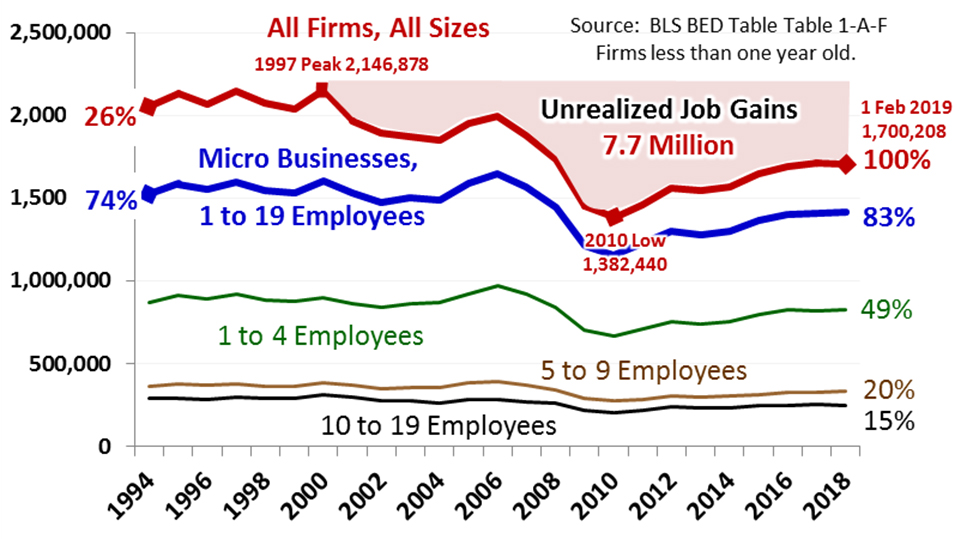
According to BES Firm Table 1-A-F data, during these 25 years, unrealized job gains amounted to 7.7 million jobs. Adjusting for population gains, lost job opportunities doubled to 15.5 million jobs. The primary reason that the numbers of unrealized job gains by firms are one-third the level of establishments is that statistics on firms are limited to legal businesses with employer tax identification numbers. Consequently, unincorporated businesses and the vast majority of nonemployer businesses are not included in the data.
Importance of Startup Businesses
Of the estimated three million startups over the last decade, tens of thousands of ultra-high growth businesses (called unicorns and gazelles) have generated millions of net new jobs for America. According to the Kauffman Foundation[18], these fleet-footed startups account for 50% of all new jobs created. Uber, Lyft, Airbnb, SpaceX, WeWork, and Pinterest are the most known examples of unicorns—startup companies that rapidly achieve a stock market valuation of $1 billion or more. Thirty-five other U.S. tech companies reached unicorn status in 2018.[19] A gazelle is a high-growth company that increases revenues by over 20% per year for four-plus years. The top-10 U.S. gazelles include Health Insurance Innovations, Stamps.com, Supernus Pharmaceuticals, Applied Optoelectronics, Paycom Software, Facebook, Nvidia, Arista Networks, Amazon.com, and LGI Homes according to Fortune magazine’s 100 Fastest Growing Companies. [20]
During the heydays of the 1970s, Bill Gates and Steve Jobs started Microsoft and Apple, two of the world’s most celebrated companies with a market capitalization (the value of the total number of shares multiplied by the present share price) of $830 billion and $1 trillion, respectively. Does one have to wonder if these companies would have started in our current austere startup environment?
According to Kauffman Foundation[21] analysis of Census Bureau’s Business Dynamic Statistics, most city and state government policies that look to big business for job creation are doomed to failure because they are based on unrealistic employment growth models. “It’s not just net job creation that startups dominate. While older firms lose more jobs than they create, those gross flows decline as firms age. On average, one-year-old firms create nearly 1,000,000 jobs, while ten-year-old firms generate 300,000. The notion that firms bulk up as they age is, in the aggregate, not supported by data.”
About Jobenomics
Jobenomics concentrates on the economics of business and job creation. The non-partisan Jobenomics National Grassroots Movement’s goal is to facilitate an environment that will create 20 million net new middle-class U.S. jobs within a decade. The Movement has reached an estimated audience of 30 million people. The Jobenomics website contains numerous books and material on how to mass-produce small business and jobs as well as valuable content on economic and industry trends. For more information see Jobenomics.com.
[1] U.S. Small Business Administration, Accelerating Job Creation in America: The Promise of High-Impact Companies, Page1, July 2011, https://www.sba.gov/sites/default/files/HighImpactReport.pdf
[2] Congressional Research Service, Small Business Administration and Job Creation, Concluding Observations, Updated 20 December 2018, Page 18, https://fas.org/sgp/crs/misc/R41523.pdf
[3] Kauffman Foundation, 2018 State of Entrepreneurship, Breaking Barriers: The Voice of Entrepreneurs, 28 February 2018, https://www.kauffman.org/what-we-do/entrepreneurship/state-of-entrepreneurship-2018?utm_source=eAlert&utm_medium=email&utm_campaign=soe2018
[4] U.S. Small Business Association, Office of Advocacy, Frequently Asked Questions, August 2018, https://www.sba.gov/sites/default/files/advocacy/Frequently-Asked-Questions-Small-Business-2018.pdf
[5] The 28.5 million American owners of U.S. nonemployer businesses will be addressed in a subsequent posting in this Year Ahead series.
[6] ADP Research Institute, National Employment Report, https://www.adpemploymentreport.com/
[7] Jobenomics, The Year (2019) Ahead Series, Part 7, Reciprocal versus Free Trade, https://jobenomics.com/wp-content/uploads/2019/02/Part-7-Reciprocal-versus-Free-Trade-10-February-2019-1.pdf
[8] U.S. Census Bureau’s Business Dynamics Statistics (BDS) provides annual measures of business dynamics (such as job creation and destruction, establishment births and deaths, and firm startups and shutdowns) for the economy and aggregated by establishment and firm characteristics. The BDS is created from the Longitudinal Business Database (LBD), a confidential database available to qualified researchers through secure Federal Statistical Research Data Centers. The use of the LBD as its source data permits tracking establishments and firms over time. Source: https://www.census.gov/ces/dataproducts/bds/
[9] U.S. Bureau of Labor Statistics’ Business Employment Dynamics (BES) is a set of statistics generated from the Quarterly Census of Employment and Wages program. These quarterly data series consist of gross job gains and gross job losses statistics from 1992 forward. These data help to provide a picture of the dynamic state of the labor market. Source: https://www.bls.gov/bdm/
[10] U.S. Census Bureau, Business Dynamics Statistics, Firm Characteristics Data Tables, Firm Age, https://www.census.gov/ces/dataproducts/bds/data_firm.html
[11] U.S. Census Bureau, Business Dynamic Statistics Press Release CB17-TPS.68, 20 September 2017, https://www.census.gov/newsroom/press-releases/2017/business-dynamics.html
[12] Wall Street Journal, Sputtering Startups Weigh on U.S. Economic Growth, 23 October 2016, http://www.wsj.com/articles/sputtering-startups-weigh-on-u-s-economic-growth-1477235874?mod=djem10point
[13] U.S. Bureau of Labor Statistics, Business Employment Dynamics, https://www.bls.gov/bdm/
[14] U.S. Bureau of Labor Statistics, Quarterly Census of Employment and Wages, https://www.bls.gov/cew/
[15] U.S. Bureau of Labor Statistics, Business Employment Dynamics, Research Data on Business Employment Dynamics by Age and Size, https://www.bls.gov/bdm/business-employment-dynamics-data-by-age-and-size.htm
[16] Business Employment Dynamics, Firm Size and Age, Table 1-A-F: Annual gross job gains and gross job losses by age and average size of firm, Age group: Less than one year old, https://www.bls.gov/bdm/business-employment-dynamics-data-by-age-and-size.htm
[17] Business Employment Dynamics, Establishment Size and Age, Table 1-A-E: Annual gross job gains and gross job losses by age and average size of establishment, Age group: Less than one year old, https://www.bls.gov/bdm/business-employment-dynamics-data-by-age-and-size.htm
[18] Kauffman Foundation, Understanding the Economic Impact of High-Growth Firms, 6 June 2016, http://www.kauffman.org/newsroom/2016/06/understanding-the-economic
[19] Inc., 35 U.S. Tech Startups That Reached Unicorn Status in 2018, https://www.inc.com/business-insider/35-us-tech-startups-that-reached-unicorn-status-in-2018.html
[20] Fortune, 100 Fastest Growing Companies, http://fortune.com/100-fastest-growing-companies/list/
[21] Kauffman Foundation, The Importance of Startups in Job Creation and Job Destruction, 9 September 2010, http://www.kauffman.org/what-we-do/research/firm-formation-and-growth-series/the-importance-of-startups-in-job-creation-and-job-destruction


