

The Trump Administration’s bold economic and job creation vision (i.e., sustained 4% GDP growth and 25 million new jobs) is progressing as planned, albeit with some bumps in the road. In December 2017, the Bureau of Labor Statistics reported that the U.S. labor force added 148,000 new jobs, which is below the 250,000 new job threshold advocated by most economists. President Trump’s first 12-months in office averaged 171,000 per month, which is still below the threshold but significantly better than President Obama, who averaged 109,000 jobs per month over 96-months in office and President Bush’s 22,000 per month over 96-months in office. (Download complete report)
First 12-Months of New Jobs by Presidential First Terms
Source: U.S. Bureau of Labor Statistics, Series Id: CES0000000001

The first 12-months of Trump Administration created 2,055,000 new jobs, which is outstanding compared to three-fourths of his predecessors. As shown, of the twelve presidents since WWII, this level of job creation puts President Trump in third-place following President’s Carter and Clinton.
Jobs Gains/Losses Since 2001

Since 2001, the monthly job creation high water mark was 524,000 new jobs in May 2010, and the low water mark for jobs losses was 823,000 in March 2009. From 2001 through 2017, the United States averaged an abysmal 71,000 new jobs per month. From an Administration standpoint,
- The Bush Administration (2001 to 2008) created an average of only 22,000 new jobs per month, due to the onslaught of two major recessions, the calamity of 9/11 and the United States’ expensive mobilization for the global war on terrorism.
- The Obama Administration (2009 to 2016) created an average 109,000 job gains per month. If the six months of the Great Recession that Obama “inherited” was subtracted, the average of the ensuing 90-month period yielded an average of 159,000 new jobs per month. Perhaps, the greatest legacy of the Obama Administration is 75-months of consecutive job gains averaging 199,000 jobs per month (not shown) during a period where the U.S. economy grew at a sclerotic rate of 1.5%.
- The Trump Administration continued the positive job creation trend with 12 consecutive months of job gains and extended the continuous job creation run to 86 months—the longest span of labor force gains since the Bureau of Labor Statistics began record keeping in February 1939. To date, the Trump Administration is averaging 171,000 job gains per month, which is good but insufficient for the Trump Administrations to create 25 million new jobs over the next decade. Jobenomics asserts that the overall economy and labor force is gaining momentum and is likely to accelerate when Washington implements tax code revisions.
To achieve President Trump’s goal of creating 25 million new jobs over the next ten years, the Administration needs to generate 212,454 new jobs per month. To compensate for good and bad months, 250,000 jobs per month is a reasonable goal to compensate for downturns. During the recent 87-month run of consecutive job gains, the United States exceeded the 250,000 job threshold 20-times or nearly one out of every five months. During the 12-months of the Trump Administration, November 2017 was the only month that exceeded the threshold with 252,000 new jobs.
Big business is the anchor tenant of the U.S. economy. Small business is the engine of the economy. Startup businesses are the seed corn of the economy. For the U.S. economy and labor force to be sustainable, all three elements must be producing goods and services efficiently and cost-effectively to be competitive in the global marketplace. Unfortunately, both U.S. small business and startup businesses are faltering. As currently structured, the new tax reform legislation will accelerate job creation to a limited degree. According to the Tax Foundation, when fully implemented the House Republican tax bill would create only a maximum of 1.6 additional new jobs over the next ten years.
If Washington does not pay more attention startup businesses and small business job creation, it is unlikely that President Trump will reach his 4% GDP and 25 million job creation vision. While the Administration’s manufacturing and big business initiatives are laudable, big businesses will continue to automate, outsource and use the bulk of their profits to make money on money as opposed to investing in their labor force. It is small businesses that created three-fourths of all new jobs this decade with little assistance from Washington.
Washington needs to focus significantly more attention on small business development to achieve sustained economic prosperity. Tax cuts help but are not the solution to the problems facing American small businesses. Proposed Administration’s small business “association health plans” will also help but yet insufficient. What is needed is a rejuvenation of small business entrepreneurial spirit and a worldview that small and self-employed businesses are a viable alternative to the decreasing number of high-paying full-time jobs. Creation of more women-owned and minority-owned business would pay huge dividends economically and socially. Washington must also look to digitally-savvy Screenagers (Generation Z) and Millennials (Generation Y) to create tomorrow’s micro-businesses to effectively compete in the emerging global digital economy and provide jobs to the expanding contingent workforce.
If Washington could motivate the 29.6 million American small businesses to create or hire only one net new employee, the small business community could help the President achieve his 25 million new jobs vision in a much shorter timeframe than he currently envisions.
Jobenomics Analysis of the State of the U.S. Economy and Labor Force.
To fully understand net labor force gains and losses, Jobenomics uses two primary sources of U.S. labor force data:
- The monthly U.S. Bureau of Labor Statistics (BLS) Employment Situation Summary, a monthly summary of all U.S. government and private sector employment, and
- The ADP National Employment Report, a monthly survey of employment by 400,000 U.S. private sector businesses by the ADP Research Institute in collaboration with Moody’s Analytics.
Jobenomics Analysis of the BLS Employment Situation Summary Report.
From a Jobenomics standpoint, employment statistics are important, but they are only a prelude to a much more important question regarding net labor force gains and losses. The U.S. labor force consists of 250 million citizens (called the civilian noninstitutional population) who are in one of three Bureau of Labor Statistics categories: Employed, Unemployed and Not-in-Labor-Force. From a Jobenomics viewpoint, it is vitally important to evaluate the give-and-take between each of these categories as opposed to emphasizing each individually. For example, increasing the labor force by 25 million new jobs (Trump’s plan) makes little economic sense if 25 million people voluntarily leave the workforce for welfare and alternative lifestyles as is happening today.
Since the beginning of the 21st Century (1 January 2000), 16.6 million people entered the workforce as opposed to 26.9 million voluntary workforce departures of able-bodied Americans—not including population growth of 45 million additional Americans (282 million in 2000 versus 327 million today). If current trends continue, the U.S. economy will eventually collapse due to the financial burden of the non-working population. Fortunately, current trends are positive, but a financial downturn could easily reverse our economic situation.
Working Versus Non-Working Populations

This graphic presents a strategic perspective of the U.S. private sector workforce covering the period from 1 January 2000 to 1 January 2018. The private sector produces the vast majority of goods and services that drive economic growth. Since the turn of the 21st Century, the U.S. private sector’s Working (Employed) population rose by 13% compared to a rise of 37% in the Non-Working Population. Jobenomics defines the Non-Working Population as Not-in-Labor-Force that rose by 39%, and the Officially U3 Unemployed, which is still 16% higher today than it was in the year 2000.
It is important to notice on the above chart, that the Non-Working Population almost equaled the size of the Working Population at the end of the Great Recession. Since the Great Recession, the Working Population has grown while the Non-Working Population has stabilized. The question to ponder for the future is whether employment and economic growth can continue to grow the workforce while simultaneously reducing the Not-in-Labor cadre?
U.S. Labor Force Gains and Losses Since 2000
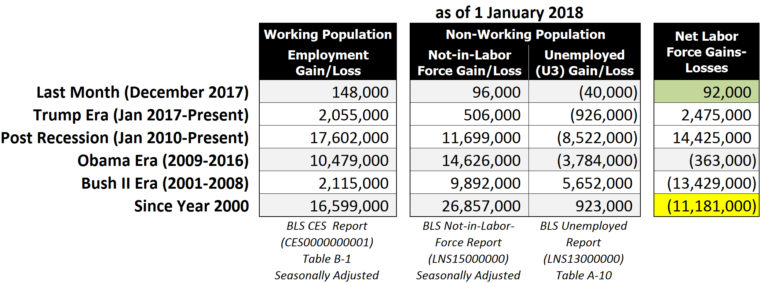
The 5 January 2018 BLS Employment Situation Summary reported that the U.S. economy generated 148,000 new jobs in December 2017, which maintained the 87-months of consecutive labor force gains—the longest span of labor force gains since BLS record keeping began in February 1939. Employment gains occurred in health care (+31,000), manufacturing (+25,000) and construction (+24,000). Average hourly earnings for all employees on private nonfarm payrolls rose by 9 cents to $26.63. Over the year, average hourly earnings have risen by 65 cents or 2.5%. The BLS also reported that 96,000 more citizens entered the Not-in-Labor-Force, and 40,000 fewer people were officially unemployed. Overall, as highlighted in green, the U.S. labor force improved by a net 92,000 workers, which is insufficient to achieve the Administration’s economic and labor force objectives.
During the first year of the Trump Administration, employment gains amounted to 2,055,000 workers, for an average of 171,250 per month. The Not-in-Labor-Force category increased by 506,000 citizens, and U3 Unemployment category decreased by 926,000. Consequently, the Trump Administration net labor force gain was 2,475,000 citizens, which compares very favorably with the Obama Administration’s 8-year/96-month labor force net loss of 363,000 workers and the GW Bush Administration’s 8-year/96-month devastating workforce net loss of 13,429,000.
Since the end of the Great Recession, from 1 January 2010 to 1 January 2018, the U.S. labor force net gain was 14,425,000 workers. 17,602,000 new workers entered the labor force. 8,522,000 workers departed unemployment rolls, and the Not-in-Labor-Force rose by 11,699,000 citizens.
During the 8-years of the Obama Era (1 January 2009 through 31 December 2016), the U.S. labor force lost a net 363,000 jobs, with 10,479,000 entering the labor force, 14,626,000 voluntarily departing, and 3,784,000 fewer people recorded as officially unemployed. It is important to remember that the first 21-months of President Obama’s first term in office, the Administration dealt with the Great Recession and recovery operations. Obama’s next 75-months in office produced the longest run of consecutive labor gains since WWII when BLS record keeping began. This 75-month run greatly exceeded the previous record of 48-months that occurred in the July 1986 to June 1990.
During the 8-years/96-months of the Bush II Era (1 January 2001 through 31 December 2008), the U.S. labor force suffered a devastating net loss of 13,429,000 jobs (2,115,000 new jobs, 9,892,000 voluntary workforce departures, and 5,652,000 newly unemployed). To a large extent, President Bush endured the perfect storm of labor force calamities, which included 8-months of the 2001 Recession (March 2001 through November 2001) and 13-months of Great Recession (December 2007 through December 2008). Additionally, the Bush Administration deal with the aftermath of the 9/11 attacks, the ensuing global war on terrorism, as well as nine major Hurricanes (Katrina, Ike, Rita, Wilma, Ivan, Charley, Frances, Jeanne, and Allison) that collectively caused over $275 billion in damage.
From the beginning of the 21st Century (1 January 2000 to 1 January 2018), the American labor force is still weaker by a net 11,181,000 workers (highlighted in yellow). This weakness is exacerbated by a population growth of 45 million additional American citizens present today compared to 2000 (282 million versus 327 million) plus the impact of a rapid rise of contingent part-time workers with a commensurate decrease in traditional full-time workers.
To sum up, BLS data indicates that the U.S. economy is not sustainable without strengthening of the U.S. private sector’s labor force. The private sector workforce consists of 125,039,000 workers, which represents only 38% of the total U.S. population of 327 million. Of the private sector workforce, approximately 60% are traditional full-time workers, and 40% are contingent workers (part-timers, freelancers, independent contractors, etc.) who earn far less income than traditional workers and often receive little or no benefits. Policy-makers and decision-leaders must concentrate on small business creation and sustainment to achieve economic and labor force growth.
Jobenomics Analysis of the ADP National Employment Report.
The December 2017 ADP National Employment Report, released on 4 January 2018, states that the U.S. non-farm private sector created 250,000 new jobs, which is more than the 146,000 new private sector jobs reported by the BLS Employment Situation Summary. The BLS 148,000 jobs estimate includes 146,000 new non-farm private sector and 2,000 government new jobs. ADP does not report on government employment, unemployment or workforce departures as does the BLS.
Of the 250,000 U.S. non-farm private sector new jobs reported by ADP, small businesses (1-49 employees) gained 94,000 jobs, midsized businesses (50-499 employees) gained 100,000 new jobs, and large businesses (500+ employees) gained 56,000 new jobs. Service-providing industries created 222,000 jobs and the goods-producing sector 28,000 job. Of the ten industry sectors, Professional/Business Services generated 72,000 new jobs, followed by Education/Health Services (+50,000), Trade/Transportation/Utilities (+12,000), Leisure & Hospitality (+28,000), Financial Activities (+19,000), Construction (+16,000), Other Services (+12,000), Manufacturing (+9,000), Natural Resources & Mining (+3,000) and Information (-1,000).
For this report, Jobenomics classifies “small business” as having 1-499 employees (the definition supported by the U.S. Small Business Administration), medium-sized business as 500-999 and large businesses as 1000+ employees. Also, Jobenomics defines micro-businesses as having 1-19 employees, which includes self-employed individuals.
U.S. Private Sector Employment by Company Size
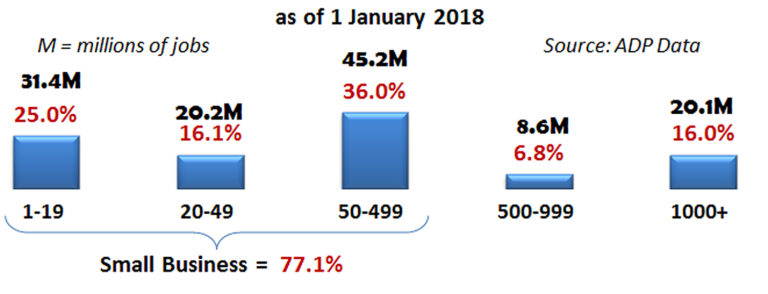
As reported by ADP, small businesses are undeniably the dominant employer in the United States. Small businesses with less than 500 employees employ 77.1% of all private sector Americans with a total of 96,823,000 employees—over 3.4-times the number of large businesses with more than 500 employees that have 28,725,000 employees. Micro-businesses with 1-19 employees employ 1.6-times the number of major corporations with over 1,000 employees (31,370,000 versus 20,141,000).
U.S. Private Sector Jobs Created This Decade by Company Size

Since the beginning of this decade, small businesses created 73.1% of all new jobs in the United States. Small businesses with less than 500 employees created 2.7-times more jobs as large businesses with 500+ employees, or 13,158,000 versus 4,853,000 new jobs respectively. Micro and self-employed businesses with 1-19 employees created 84% as many jobs as major corporations with over 1,000 employees (3,040,000 versus 3,631,000).
U.S. Private Sector Jobs Created Last Month by Company Size
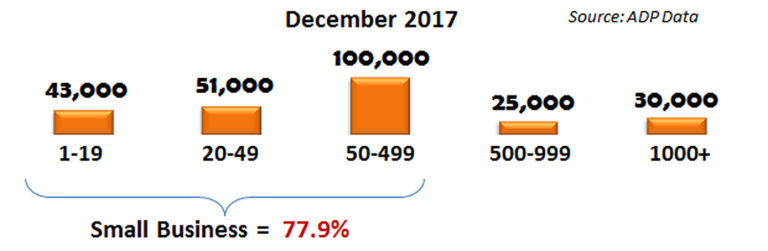
Last month (December 2017), U.S. small business (1-499 employees) created 77.9% of all new jobs. This percentage is relatively good compared to previous months: 78.4% in November, 61.9% in October, 41.9% in September, 51.7% in August, 74.6% in July, 68.4% in June, 77.2% in May, 72.2% in April and 81.9% in March.
U.S. Micro-Business Job Creation Engine Is Faltering
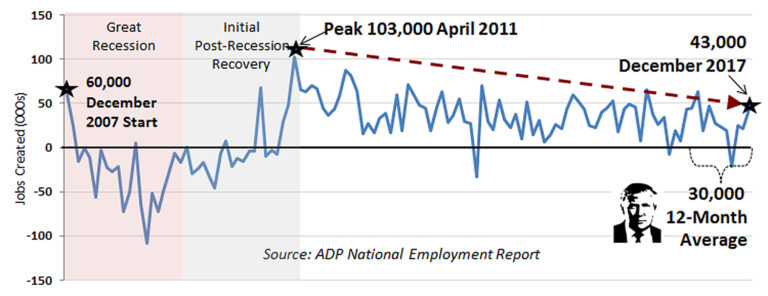
Alarmingly, micro-business job creation has dropped 58% since the post-recession peak in April 2011 of 103,000 new jobs created to 43,000 in December 2017. The average micro-business job creation over 12-months of the Trump Administration was only 30,000 per month. Micro-businesses underpin the U.S. economy. Continued denigration of these businesses can only lead to economic stagnation.
Micro-businesses are the lifeblood of the emerging digital economy that will equal the size and scope of today’s traditional economy within the next few decades. The United States will quickly be relegated to a back-bench position to countries like China if American companies fail to compete effectively in the global digital economy. China has a much superior digital economy strategy and a public/private implementation effort than the United States. For information on this topic, download the Jobenomics’ “China’s Digital Economy Quest” report at https://jobenomicsblog.com/chinas-digital-economy-quest/.
Jobenomics Analysis of Various Economic Reports.
The rate of small business startups is also dropping precipitously. Business startups are the seed corn of the U.S. economy. Without the planting and fertilization of these seedlings, the fields of American commerce will be fallow.
Of the estimated three million startups over the last decade, tens of thousands of ultra-high growth businesses (called unicorns and gazelles) have generated millions of net new jobs for America. According to the Kauffman Foundation, these fleet-footed startups account for 50% of all new jobs created. Uber, Lyft, Airbnb, SpaceX, WeWork, and Pinterest are recent examples of unicorns—a startup company that rapidly achieves a stock market valuation of $1 billion or more. A gazelle is a high-growth company (of any size, but usually a recent entrepreneurial startup or micro-business) that increase revenues by over 20% per year for over four years or more. The top-10 U.S. gazelles include Natural Health Trends, Paycom Software, Lending Tree, ABIOMED, MiMedx Group, Facebook, NetEase, Ellie Mae, Amazon.com and Arista Networks, according to Fortune magazine.
Regarding new starts (firms less than 1-year old), the Census Bureau’s Business Dynamic Statistics indicate that the United States is now creating startup businesses at historically low rates, down from 16.5% of all firms to 8% in 2014 (latest data). Based on a Wall Street Journal (WSJ) analysis of this Census Bureau data, “If the U.S. were creating new firms at the same rate as in the 1980s…more than 200,000 companies and 1.8 million jobs a year” would have been created.
During the heydays of the 1970s, Bill Gates and Steve Jobs started Microsoft and Apple, two of the largest U.S. companies today with a market capitalization of $649 billion and $870 billion respectively. One has to wonder if these companies would have started in our current austere startup environment?
According to a Census Bureau’s Business Dynamic Statistics press release on 20 September 2017, in 2015, 414,000 U.S. startup firms created 2.5 million new jobs, which is well below the pre-Great Recession average of 524,000 startup firms and 3.3 million new jobs per year for the period 2002-2006. In 2015, job creation minus job destruction equaled net job creation of 3.1 million, which supports the Jobenomics hypothesis that net job creation is a far more important statistic for policy-makers than just focusing on only new jobs. Other tidbits of the 2017 Business Dynamic Statistics press release include:
- 5 million U.S. small businesses (1-499 employees) created 45% (1,400,711) of all net new jobs compared to 20 thousand large businesses (500+ employees) that created 55% (1,690,591) net new jobs.
- 5 million micro-businesses (1-19 employees) net job creation equated to 14% (434,203) of all net new jobs.
- Net job creation in urban areas was over twice the rate of rural areas, or 2.7% versus 1.2% respectively.
According to another Kauffman Foundation analysis of the Census Bureau’s Business Dynamic Statistics, most city and state government policies that look to big business for job creation are doomed to failure because they are based on unrealistic employment growth models. “It’s not just net job creation that startups dominate. While older firms lose more jobs than they create, those gross flows decline as firm’s age. On average, one-year-old firms create nearly 1,000,000 jobs, while ten-year-old firms generate 300,000. The notion that firms bulk up as they age is, in the aggregate, not supported by data.”
Jobenomics agrees with both the WSJ and Kauffman analyses. Moreover, the Jobenomics 20-part series, entitled President Trump’s New Economy Challenge provides a detailed analysis why the Trump Administration’s bold economic (4% GDP) and job creation (25 million new jobs) vision is likely to fall short due to its concentration on big business rather than small business creation and sustainment. Small business is not only critical to net job creation; it is the primary determinant for GDP growth given the fact that big businesses are increasingly looking at automation and outsourcing (to foreign workers or domestic contingency workers) to replace the standard full-time labor force.
The ideal rate for U.S. GDP growth is around 3%. Any GDP growth below 2% is considered sclerotic growth that makes the U.S. economy vulnerable to financial downturns.
Real GDP Quarterly Percent Change This Decade
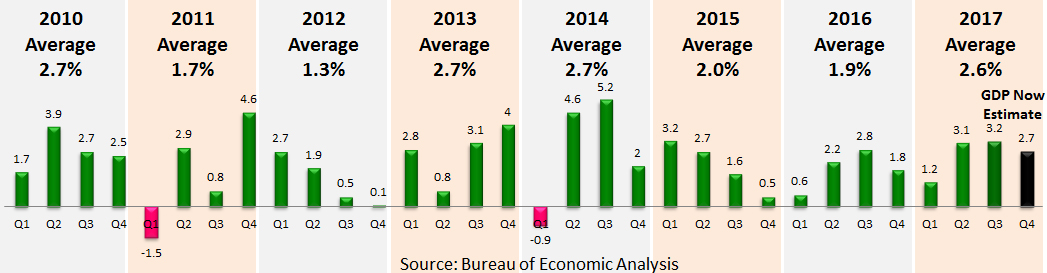
According to the U.S. Bureau of Economic Analysis (BEA), during the post-recession recovery period from Q1 2010 through Q3 2017, U.S. GDP averaged 2.3%. In 2015 and 2016, U.S. GDP grew by subpar rates of 2.0% and 1.9% respectively. During the 32-quarters (8-years) of the Obama Administration, GDP averaged 1.9%. During the first three-quarters of the Trump Administration, GDP averaged 2.5%. However, the last two quarters have posted 3.1% and 3.2% gains. For Q4 2017 (October, November and December 2017), the Federal Reserve Bank of Atlanta’s GDPNow forecast is 2.7% as of 5 January 2018, down from a high 4.5% on 1 November 2017. The GDP Now’s “Blue Chip” survey of the bottom 10 and top 10 leading business economists forecast that Q4 2017 growth will fall between 2.4% and 3.2%.
While GDP growth does not ensure employment growth, sclerotic GDP growth discourages business hiring, consumer spending and labor force expansion. Sclerotic GDP growth also discourages lower rates of unemployment and voluntary workforce departures. Negative GDP growth creates recessions and depressions depending on the severity and longevity of the contracting economy.
The period of sclerotic GDP growth from 2000, has dramatically impacted the American middle-class and the U.S. labor force that is weaker by 11 million workers today than at the beginning of the 21st Century. Even though wages have improved in the last year, for most American workers, real wages (purchasing power) have not increased significantly for decades. America’s aggregate household income has shifted from middle-income to upper-income households, causing many middle-class workers to leave the workforce altogether. The solution to building a robust middle-class is to accelerate GDP growth, which requires the creation of more productive private sector jobs, which, in turn, can only be generated by a massive expansion of the small business sector.
Concluding Thoughts.
President Trump’s vision of a “dynamic and booming economy” is one that can produce a GDP growth rate of “4% over the next decade.” This vision ultimately depends on mass-producing business, especially small business, in sufficient quantities to create 25 million net new jobs. Sclerotic (0% to 2%) or recessive (negative) GDP rates depreciate a government’s legitimacy. Robust GDP growth of over 3% will have the opposite effect.
According to the nonpartisan Congressional Budget Office’s 2017 to 2027 Budget and Economic Outlook report, “over the next five years, the monthly increase in nonfarm payroll employment, which is estimated to average 160,000 jobs in the first half of 2017, is projected to settle down to an average of 64,000 jobs.” If this CBO forecast is correct, the next decade is likely to produce only 9 million American jobs, which is far short of President Trump’s projection of 25 million new jobs. Note: last year’s BLS Employment Projections: 2014-24 Summary report forecasts that the United States will produce only 9.9 million new jobs over the next decade.
Jobenomics tends to agree with these rather gloomy CBO and BLS forecasts for the reasons discussed in the Jobenomics 20-part series entitled President Trumps New Economy Challenge. However, the Trump Plan can be amended to change CBO and BLS labor force projections from negative to positive.
With proper leadership, the Administration can lift tens of millions of Americans out of poverty by making the following four structural changes to President Trump’s economic and job creation plan:
- Balancing the traditional standard industrial economy with the newly emerging nonstandard digital economy,
- Mitigating the mass-exodus of capable workers who are voluntarily departing the U.S. labor force for lives of dependency and alternative (often illicit) lifestyles,
- Addressing the challenge of the ever-growing contingency workforce that will soon be the dominant form of labor in the United States, and
- Mass-producing small and self-employed businesses—the engine of the U.S. economy—and the employer of the vast majority of Americans.
If the Trump Administration can achieve 4% GDP growth in a stable global economy, the U.S. economy will boom, and Americans will be euphoric. This feat will not be easy. The last time that the United States reached 4% in a single year was 2001. The last time that the United States reached 4% in ten consecutive years during the last 50-years was never (3.5% was the highest from 1976 to 1985). Notwithstanding, if the Trump Administration can tie the 3.5% record over the next decade, they will be vindicated and worthy of much praise.
About Jobenomics: Jobenomics deals with the economics of business and job creation. The non-partisan Jobenomics National Grassroots Movement’s goal is to facilitate an environment that will create 20 million net new middle-class U.S. jobs within a decade. The Movement has a following of an estimated 20 million people. The Jobenomics website contains numerous books and material on how to mass-produce small business and jobs as well as valuable material on economic and business trends. For more information see https://jobenomics.com/.

