

COVID 2021
Part II, Workforce Impact
By: Chuck Vollmer, Jobenomics Founder & President
16 January 2020
The coronavirus could be more destructive to the U.S. workforce in 2021 than in 2020.
Executive Summary
Most Americans are ready to put the pandemic in their rearview mirror and look forward to a new year that will provide a sense of normalcy. Unfortunately, the coronavirus could be more destructive in 2021 than in 2020. COVID-related deaths will not magically disappear with the advent of new vaccines. Unemployment rates and small business closures are likely to increase due to a prolonged economic slowdown. The divide between Wall Street and Main Street will widen due to the Federal Reserve Bank (Fed) stimulus policies that favor making money on money rather than developing human capital. Socioeconomic mobility probably will not significantly improve even with Congressional stimulus packages oriented to short-term aid rather than long-term production of new businesses and careers.
This pandemic provides a unique opportunity to create a more equitable society by giving ordinary citizens the means to be self-sufficient and independent. Congress and the Fed wisely earmarked $2 trillion out of $13 trillion worth of COVID stimulus programs for failing small businesses. These policymakers should allocate an equivalent amount of money ($7 trillion remains uncommitted) to mass-produce locally owned and operated startup businesses in under-resourced communities. By boosting local ownership, beleaguered neighborhoods will not only prosper economically but reduce homelessness, poverty, crime, and violence.
PART I Update: COVID 2020 (posted 3 January 2021)
Jobenomics COVID 2021 Likely and Worst Case Scenarios
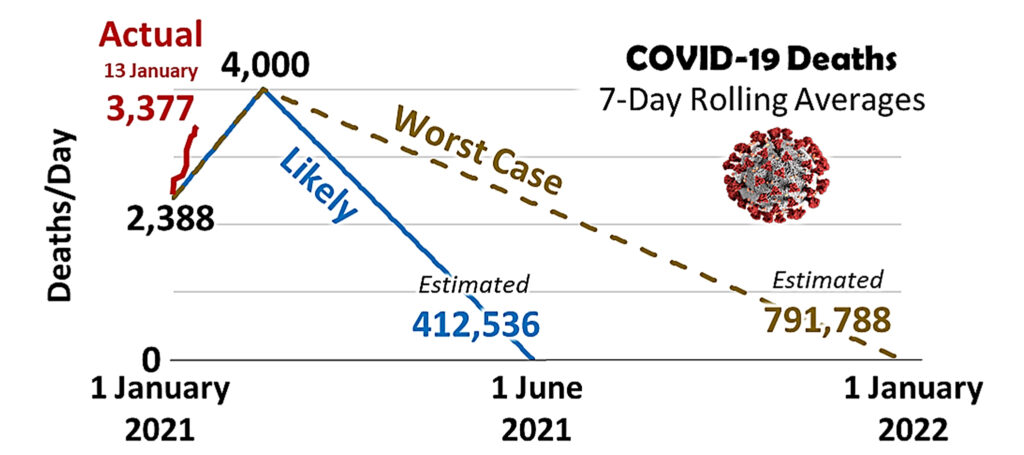
As of this posting, U.S. COVID-19 confirmed deaths soared from 2,388 daily deaths (7-day average) on 1 January to 3,377 deaths per day on 13 January 2021—an astounding 41% increase in two weeks.
As shown and as forecast by the CDC, the “Likely” and “Worse Case” Jobenomics scenarios increase steadily for 45 days until reaching an average of 4,000 daily deaths by mid-February. The United States already exceeded this deadly 4,000 threshold three times in the first two weeks in January. Consequently, COVID 2021 is increasingly likely to claim between 412,536 and 791,788 by June 2021 or January 2022, respectively.
While horrid, 412,536 and 791,788 deaths equate to only 0.1% and 0.2% of our population. Comparatively, the Black Death killed 33% of people in 14th Century Europe. During the 1918 Spanish flu, the United States lost 7-times the number of citizens (0.7% or 675,000 out of a population of 103 million). Today, heart disease (647,457) and cancer (599,108) collectively kill 0.4% of all Americans. Despite the severity of these pandemics and chronic diseases, humans find a way to survive and rebuild shattered lives and livelihoods.
Unlike wartime losses that claim prime-age workers, 92% of all American lives harvested by COVID 2020 Grim Reaper were over 55 years old. If we can get our prime-age workers back on the job during COVID 2021, economic growth should quickly resume. However, returning people to work is problematic if the American COVID death rate continues to climb and businesses shuttered.
PART II: COVID 2021 Workforce Impact (16 January 2021)
Working versus Non-Working Populations
1 January 2000 to 1 January 2021
Source: U.S. Bureau of Labor Statistics
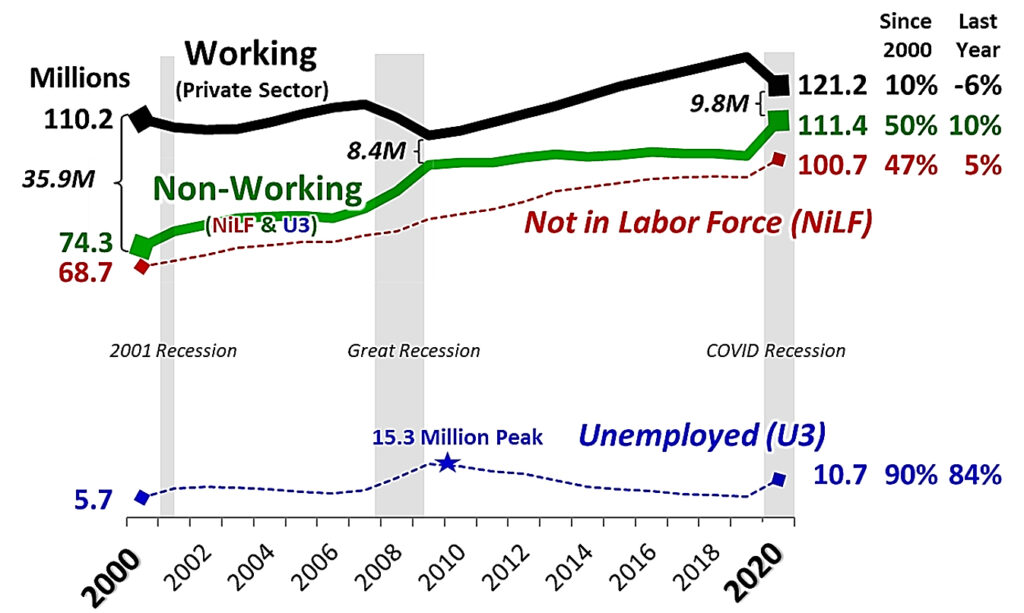
This graphic presents a strategic perspective of the U.S. Private Sector Working Population (Employed) and the Non-Working Population (Unemployed and Not-in-Labor-Force).
The private sector workforce produces the goods and services that drive U.S. economic growth.
From 1 January 2000 to 1 January 2021, the employed private sector Working Population (solid black line) grew by a meager 10% (from 110.2 million to 121.2 million workers) compared to a Non-Working Population (solid green line) rise of 50% (from 74.3 million to 111.4 million citizens).
In the year 2000, the gap between workers and non-workers was 35.9 million people or 1.5 workers for every work-capable person. This gap shrunk to 8.4 million at the end of the Great Recession and subsequently widened during the Obama and Trump Administrations. Then the COVID 2020 Recession hit. Due to COVID 2020, the number of employed workers dropped by 6%, and the non-working cadre increased by 5%, closing the gap to only 9.8 million as of 1 January 2021.
Given Jobenomics COVID 2021 prognosis, it is highly probable that the number of sideline personnel could easily exceed the number of employed workers by June 2021. Considering the high rate of small business closures and the number of furloughed workers (currently counted as employed) becoming officially unemployed, the likelihood of non-workers outnumbering the labor force is relatively certain.
The most shocking trend involves the Not-in-Labor-Force cadre that has grown from 68.7 million in 2000 to 100.6 million today, a growth of 47%. Even more astonishing is that only 7% of the people in this cadre “currently want a job,” according to BLS survey data.
Actively Looking To Be “Unemployed”
The civilian labor force consists of the employed and the unemployed. The remainder—those who have no job and are not looking for one—are counted as not in the labor force. The Not-in-Labor-Force category includes retired persons, students, those taking care of children or other family members, and others who are neither working nor seeking work.
To be included in the Not-in-Labor-Force category, survey respondents must answer “no” to only one of the following BLS survey questions (interviewers are instructed to emphasize the bolded words):
- Do you currently want a job, either full or part-time?
- What is the main reason you were not looking for work during the last four weeks?
- Did you look for work at any time during the last 12 months?
- Last week, could you have started a job if one had been offered?
If a respondent answers “yes” to all four questions, that person is considered Unemployed. If the respondent says “no” to any query, that individual becomes a part of the Not-in-Labor-Force.
Sooner or later, the American public will figure out that the current way our government calculates unemployment is seriously misleading. Under the current BLS system, it is theoretically possible for the United States to have a zero-unemployment rate if all unemployed people quit looking for work and joined those in the Not-in-Labor-Force. In other words, if all respondents answer “no” to any one of the four BLS survey questions, the United States can have a zero rate of unemployment.
U.S. policymakers must shift their attention from unemployment to include understanding why Americans, who can work, are no longer looking for work. When as many people drop out of the labor force as enter it, the U.S. economy cannot grow as it should.
Functional Unemployment
Economists generally divide unemployment into two broad categories of voluntary unemployment and involuntary unemployment.
- Voluntary unemployment refers to individuals who leave their jobs willingly searching for other employment.
- Involuntary unemployment involves fired or laid off personnel who must look for another job.
- Jobenomics adds a third category called “functional unemployment,” which includes all work-capable adults whether or not they are looking for a job.
The ability to work should be the determining factor for unemployment instead of whether a person is looking for work. Jobenomics contends that all Americans who can work, regardless if they are looking or not, should be considered “functionally” unemployed.
Jobenomics defines functional as capable of working. An adult who can work, but chooses not to work, should be classified as unemployed for the same reason that “discouraged,” “marginally attached,” and “part-time workers for economic reasons” are included in the BLS unemployment categories.
Functional Unemployment Rate
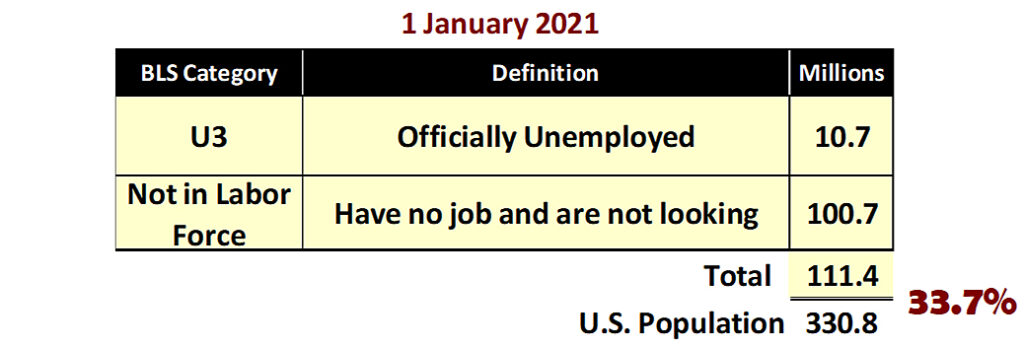
Jobenomics contends that the Unemployment Rate statistic is overused and misleading. The current number of unemployed Americans actively looking for work stands at 10.7 million unemployed, or 6.7% of the civilian workforce. Adding the 100.7 million work-capable adults in the Not in Labor Force cadre would make the functional unemployment rate 33.7%, a better representation of the actual number of sidelined citizens.
Employment Status Of The U.S. Civilian Population
Source: U.S. Bureau of Labor Statistics, Household Survey[1]
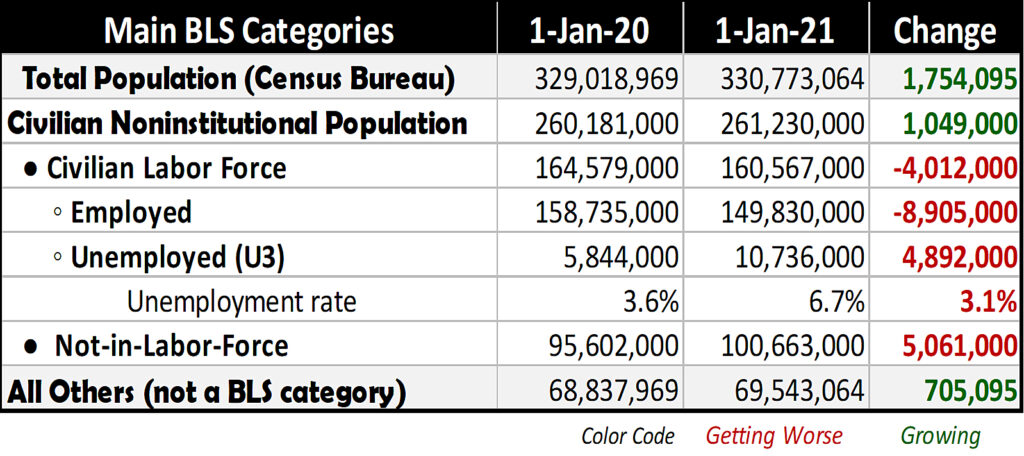
This table shows the main BLS labor categories compared to the rest of the population and the dramatic labor force changes that transpired during COVID 2020.
- As highlighted in green, the Total Population, the Civilian Noninstitutional Population (citizens who are working, unemployed, and persons who can work but choose not to work), and All Others (mainly people, like children, who cannot work) grew by 1.8, 1.0, and 0.7 million, over the last year.
- As highlighted in red, the three major Civilian Labor Force categories (Employed, Unemployed, and the Non-in-Labor-Force) worsened by 8.9, 4.9, and 5.1 million, respectively.
- The official Unemployment Rate is now 6.7%, up from 3.6% a year earlier and down from 14.7% in April 2020. As discussed in the previous paragraph, this unemployment rate is seriously misleading since it only represents the percentage of citizens engaged in the pursuit of working.
The U.S. workforce, the driving force for our economy, took a massive blow during COVID 2020. There are 1.8 million more Americans to support, with 8.9 million fewer workers and nearly 10 million more workers on the dole who will have to rely upon personal savings, familial support, or public assistance to exist. If this trend continues during COVID 2021, the U.S. labor force and the economy will be in the hurt locker.
Growing Overhead Burden
331 Million Total U.S. Population
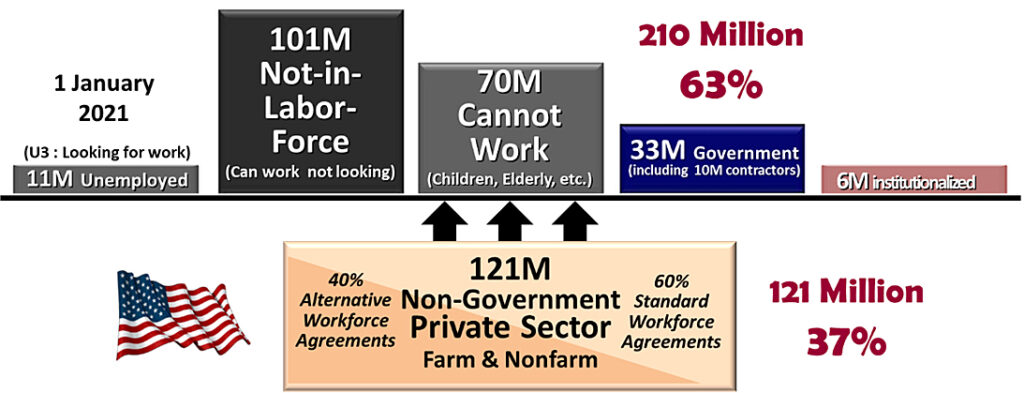
Only 37% of all Americans financially support the rest of the country. Out of a total population of 331 million, only 121 million private-sector workers support 101 million people who can work but chose not to work, 70 million who cannot work, 33 million government workers, and 13 million unemployed.
The growing contingent labor force of lower-paid wage earners makes the private-sector labor force’s overhead burden even more precarious. Jobenomics estimates the contingent workers (part-time, self-employed, independent contractors, temporary workers, on-call, and day laborers with “alternative” or “nonstandard” work agreements) to be 60,000,000 employed Americans or 40% of the total workforce (private sector and government).
The pandemic accelerated the shift from full to part-time/task-oriented workers. Consequently, the so-called gig/contingent workforce economy will supersede the traditional employer-based economy within the next couple of years. COVID 2021 will make this transition more profound and disconcerting for American workers.
Job Openings By Industry
Source: U.S. Bureau of Labor Statistics[2]
6,527,000 Unfilled Jobs
November 2020, Thousands (000s)
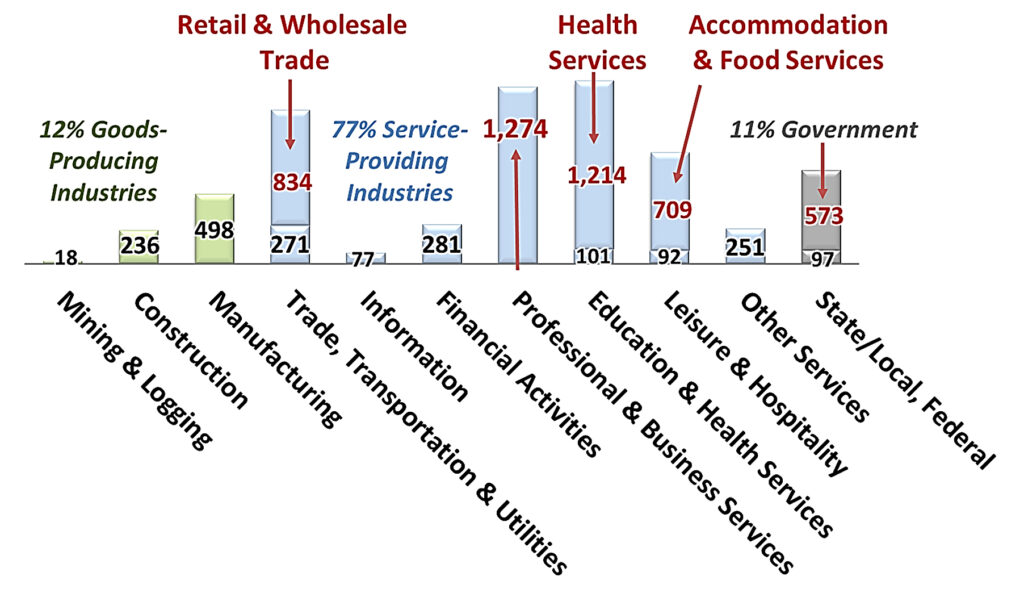
Jobenomics is genuinely concerned that the $13 trillion worth of pandemic stimuli from the U.S. government (discussed in a later section) creates a sense of workfare apathy. Even with 6,527,000 open jobs, 93,332,000 out of the 100,663,000 surveyed people in the Not-in-Labor-Force “do not want a job now.”[3]
Why work when you can get paid well not to work? If the pandemic persists, the government will undoubtedly replenish the Paycheck Protection and Income Support Programs as current Cornucopia funds run dry. A new $1.9 trillion stimulus package is even in the offing.
Stay tuned for Part III of this COVID 2021 report that discusses the current $13 trillion worth of U.S. government stimulus packages and the new Biden Administration proposal for an additional $1.9 trillion.
Jobenomics deals with the economics of business and job creation. The non-partisan Jobenomics National Grassroots Movement’s goal is to facilitate an environment that will create 20 million net new middle-class U.S. jobs within a decade. The Movement has reached an estimated audience of 30 million people. The Jobenomics website contains numerous books and material on mass-producing small businesses and jobs and valuable content on economic and industry trends. For more information, see Jobenomics.com.
[1] U.S. Bureau of Labor Statistics, Economic News Release, Household Survey Data, Table A-1. Employment status of the civilian population by sex and age, https://www.bls.gov/news.release/empsit.t01.htm
[2] U.S. Bureau of Labor Statistics, 9 December 2020, Table 1. Job openings levels and rates by industry and region, seasonally adjusted https://www.bls.gov/news.release/jolts.t01.htm
[3] U.S. Bureau of Labor Statistics, Employment Situation Summary, Economic News Release, Table A-1, Persons who currently want a job, 8 January 2021, https://www.bls.gov/news.release/empsit.t01.

