
Gross domestic product (GDP) is the best way to measure a country’s economy. Today, the ideal rate for U.S. GDP growth is over 3%. Any GDP growth below 2% is considered sclerotic growth that makes the U.S. economy vulnerable to financial downturns. In mature economies, overheating and asset bubbles cause GDP to grow at rates exceeding 4%. To achieve a sustainable annual rate of 4% GDP growth over an entire decade, as President Trump envisions, one would have to turn the clock back to the 1940s, 1950s, and 1960s that produced 6.0% 4.3% and 4.5%, respectively. (Download this Post.)
Year-over-Year GDP History (1930 to Present)
Source: U.S. Bureau of Economic Analysis, Table 1.1.1., Decade Average[1]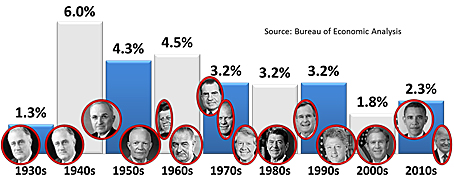
Achieving President Trump’s sustained (without overheating and bubbles) 4% GDP year-over-year growth goal over the next decade will be challenging. The last time that the United States produced 4% over ten consecutive years during the previous 5-decades was never (3.5% was the highest from 1976 to 1985). Notwithstanding, if the Trump Administration can tie the 3.5% record over the next decade, the President will be worthy of much praise and his controversial policies largely vindicated.
U.S. GDP History (1930 to Present)
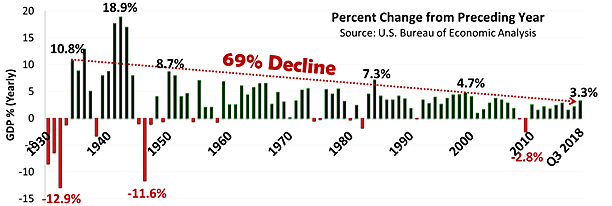
This chart, derived from the U.S. Bureau of Economic Analysis (BEA) data, indicates that the U.S. GDP history from 1930 to present has been on a long downward path. Since the first positive GDP growth year after the end of the Great Depression, U.S. GDP growth declined 69% from 10.8% in 1934 to 3.3% today (average of the first three quarters in 2018).
GDP Annual Growth Rates (2000 through 2018)
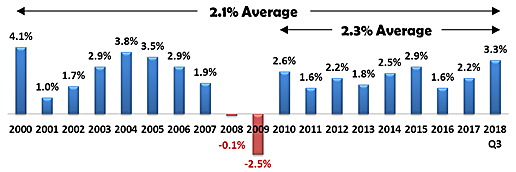
This chart shows the annual GDP roller coaster ride since the turn of the Century. Given current trends, 2018 will be the first year since 2005 to break the 3% yearly threshold.
Real GDP Quarterly Percent Change This Decade
Source: BEA, Table 1.1.1., Percent Change from Preceding Quarter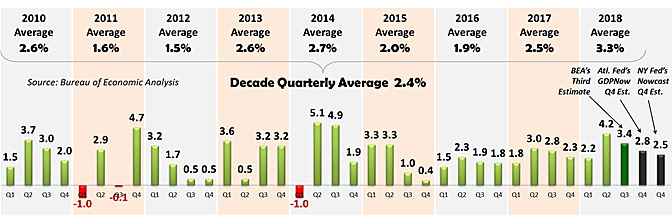
Per BEA data[2], during the post-recession recovery period from Q1 2010 through Q3 2018, U.S. quarter-over-quarter GDP growth averaged 2.4%. During the 32-quarters of the Obama Administration, GDP averaged 1.9%. During the first 7-quarters (Q1 2017 through Q3 2018), the Trump Administration averaged 2.8% GDP growth with a high-water mark of 4.2% in Q2 2018. During President Trump’s first year (2017) in office, quarterly GDP growth averaged 2.5%. For the first three quarters in 2018, the Trump Administration’s average is currently 3.3%.
The latest (21 December 2018) BEA estimate (third estimate) reported a 3.4% rate of GDP growth for Q3 2018. Even though 3.4% is 0.8% below the 4.2% rate of GDP growth in Q2 2018, it is still an excellent percentage and indicator of robust economic GDP growth considering the fact that it is almost than double the 1.9% GDP growth in 2016. The BEA will release its Q4 2018, 2018 Annual, and Q1 2019 Advance Estimate statistics on 30 January 2019.
The Federal Reserve (U.S. central bank in charge of U.S. monetary policy) banks of Atlanta and New York use BEA’s GDP data to predict future GDP growth. The Federal Reserve Bank of Atlanta and Federal Reserve Bank of New York forecasting models are based on statistical filtering techniques that are common in big data analytics. Because these banks use different models, they can generate different forecasts for GDP growth.
Federal Reserve Bank of Atlanta’s GDPNow model:
- For Q4 2018, as of 8 January 2019, the GDPNow initial forecast is 8%.
- For Q4 2018, the Federal Reserve Bank of Atlanta’s “Blue Chip consensus” survey of the top ten and bottom ten forecasts of leading business economists averages 6% GDP, with a low estimate of 2.0% and a high estimate of 3.1%.[3]
Federal Reserve Bank of New York Nowcast model:
- For Q4 2018, as of 4 January 2019, the Nowcast forecast is 5%.
- For Q1 2019, as of 4 January 2019, the Nowcast forecast is 14%.[4]
If these forecasts are correct, 2019 will start with a major downward trend from 4.2% in Q2 2018, 3.4% in Q3 2018, 2.8% to 2.5% in Q4 2018 (published on 30 January 2019) to 2.14% in Q1 2019.
Due to tighter financial conditions and a fading fiscal stimulus, many economists forecast much slower GDP growth over the next decade. The Congressional Budget Office projects that real and real potential GDP growth over the 2018-2019 period will average only 1.9%.[5] Goldman Sachs Macro Outlook 2019 report projects the U.S. GDP “growth is likely to slow significantly next year, from a recent pace of 3.5%+ to roughly our 1.75% estimate of potential by end-2019.”[6] Economic projections of Federal Reserve Board members and Federal Reserve Bank presidents (the people responsible for setting U.S. monetary policy) predict that U.S. real (adjusted for inflation) GDP will decelerate from 3.1% in 2018 to 2.5% in 2019, 2.0% in 2020 and 1.8% in 2021.[7]
Achieving President Trump’s campaign goal of sustained 4% GDP year-over-year growth over the next decade will take a lot of work and luck. The last time that the United States generated 4% over 10-consecutive years in recent history was never. Over the previous 5-decades, the best 10-consecutive year run was 3.5% from 1976 to 1985. Notwithstanding, if the Trump Administration can even tie the 1976 to 1985 3.5% record over the next decade, the much-maligned President will be worthy of abundant praise and his controversial policies largely vindicated.
Longest Running Post-Recession Recoveries (Months)
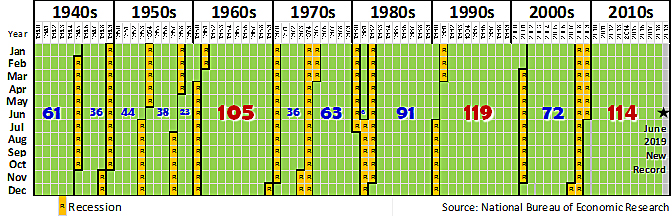
From the end of the Great Recession in June 2009 to 1 January 2018, the United States economy delivered 114 straight months of GDP growth, which puts this recession-free run in second place over the last eight decades. The 1990s had the longest run of 119 months. If the current 114-month period of economic expansion continues, the United States will upend the historical record of 119 months in June 2019—a little over 60% through President Trump’s first term in office. Not only will it beat the 1990s expansion, but it will also be the longest expansion since 1857.
While the current 114-month period of economic expansion is phenomenal, the United States is tied for fifth-place globally. China’s uninterrupted GDP growth span began in December 1989 and is now an incredible 349 months in duration. Other long-runs include Australia (325 months since December 1991), India (266 months since November 1996), South Korea (121 months since December 2008), and Germany (114 months since June 2009)—the same as the U.S. expansionary period.
As stated by the BEA, “GDP is the value of the goods and services produced by the nation’s economy less the value of the goods and services used up in production. GDP is also equal to the sum of personal consumption expenditures, gross private domestic investment, net exports of goods and services, and government consumption expenditures and gross investment.” [8]
Personal Consumption/Expenditures as a Percent of U.S. GDP
Source: BEA, NIPA Tables, Table 1.1.5. Gross Domestic Product[9]
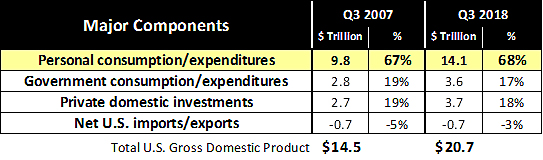
PCE (highlighted in yellow) grew from $9.8 trillion in Q3 2007 (the fiscal quarter before Great Recession) to $14.1 trillion in Q3 2018, or 67% and 68% of GDP respectively. Personal consumption and expenditures (PCE) is overwhelmingly the primary component and driver of the U.S. economy. PCE is determined by how much of the income earned by households is spent on purchased goods and services. PCE is dependent on a growing labor force and the wages that the workers receive. If labor and wages stop growing, then GDP stops growing. The opposite is also true.
According to the Bureau of Labor Statistics, PCE consumes 80% of average income before taxes. In 2017, the average American consumer unit (singles, married with and without children) spent $60,600, an increase of 4.8% over 2016. Housing took the most substantial percentage (33%) of expenditures, followed by transportation (16%), food (13%), personal insurance and pensions (11%), and healthcare (8%).[10]
Government consumption/expenditures and private domestic investments are the next two most significant GDP components. Due to budget, debt and deficit considerations, government consumption/expenditures dropped 3% as a percentage of GDP from Q4 2007 to Q3 2018. Given the current bipartisan stalemate in Washington and recent tax cuts (less government revenue), government consumption/expenditures are likely to drop even further. Likewise, private domestic investments fell slightly from 19% in 2007, before the Great Recession, to 18% today. Given the magnitude of recent tax cuts, private sector domestic investments should have improved dramatically via corporate investments in the recapitalization of the industrial base and its workforce. Unfortunately, internecine political warfare in Washington, the prospect of a full-scale trade war, stock market volatility, and global turbulence has made corporate decision-makers risk-averse. From a Jobenomics perspective, private sector domestic investments in 2019 are likely to remain low.
In the 1990s, U.S. multinational companies began aggressively outsourcing American jobs to lower-cost countries, like China, Mexico, and Vietnam. This practice stagnated American wage growth in favor of building middle-classes in developing countries. As the post-Cold War leader, assisting foreign economies was an admirable pursuit. However, the United States now needs to focus on the restoration of America’s middle-class labor force.
The U.S. trade deficit (U.S. imports/exports) is the only major component of U.S. GDP that continues to be negative costing millions of jobs that, in turn, throttle GDP growth.
U.S. Trade Deficit Grew To $12.4 Trillion Since 1977
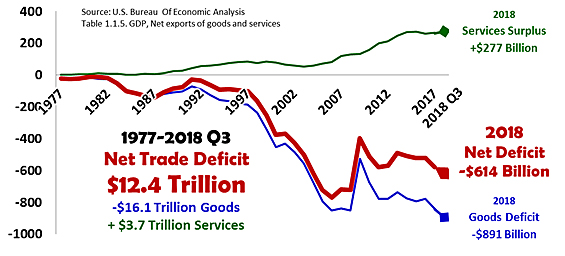
From the year 1997 through Q3 2018, the year-over-year goods trade deficit totaled a staggering $12.4 trillion.[11] President Trump’s recent reciprocal trade policies are designed to mitigate the outflow of U.S. dollars and recapitalize America as opposed to modernizing our competitors.
Over the last 4-decades, $12.4 trillion worth of trade deficits of combined goods and services ravaged domestic U.S. industries and workers. A trade deficit in goods (tangible items such as manufactured products) was $16.1 trillion that was offset by a surplus of $3.7 trillion of services. It is important to note that a significant portion of the services trade surplus was due to foreign travel and business services that help developing countries build their economies. According to recent government data (final 2018 data is not yet available), 2018 portends to be the worst year ever with a goods deficit of $891 billion.
While a trade deficit of $12.4 trillion is a considerable amount, the trade deficit pales in comparison to $70 trillion worth of U.S. direct investment abroad over the same period. Of the $70 trillion, $32 trillion (45%) was spent on establishing holding companies (primarily for U.S. tax evasion) and U.S. industries abroad, $15 trillion (21%) on financing and banking for foreign projects, and $12 trillion (17%) for overseas manufacturing and joint venture efforts. [12]
In 2017, U.S. direct investment abroad was $6.0 trillion, and the foreign direct investment in the United States was $4.0 trillion—an outflow of $2 trillion. Europe received the most money ($3.5T), followed by Latin America and Other parts of the Western Hemisphere ($1.0T), Asia/Pacific ($941B), Canada ($391B), Middle East ($69B) and Africa ($50B). In 2017, U.S. multinational enterprises (MNEs) earned an income of $471 billion on their investment abroad (8% of the amount of the $6T total) while Foreign MNEs earned revenue of $174 billion on their investment in the United States.
While U.S. MNEs earned almost three times the amount of money abroad compared to foreign MNEs did in the United States, U.S. MNEs contributed significantly more to external economic development than foreigners did for America. U.S. direct investment abroad is often used for the development of modernized transportation systems and digital infrastructures, and state-of-the-art international industrial and commercial conglomerates. Foreign direct investment in the United States is usually oriented to building capacity for foreign exports to the United States or investing in high-tech U.S. startup firms. [13]
Trade deficits and foreign direct investment are not the only issues depressing GDP growth. Trade barriers (quotes, licensing, etc.) and the theft of American intellectual property take a toll on American labor and industry. The U.S. Commission on the Theft of American Intellectual Property states that the intellectual property theft (cyber theft, counterfeit goods, software piracy, and trade secrets theft) costs the American economy as much as $600 billion a year with the majority attributed to China. In addition to annual financial losses of up to $600 billion per year, intellectual property theft causes suppression of GDP growth and innovation, tens of millions less U.S. jobs, and billions of dollars lost in personal, household and family incomes.[14]
Fortunately, President Trump’s tough stand on trade is producing results. The President of the European Commission, Jean-Claude Juncker, recently agreed to work together toward “zero tariffs, zero non-tariff barriers and zero subsidies on non-auto industrial goods.” In July 2018, Germany’s chancellor, Angela Merkel, said that Germany is willing to back lower tariffs on U.S. auto imports. The CEOs of Germany’s biggest carmakers reportedly voiced support for eliminating barriers. In September, the Trump Administration successfully negotiated a landmark United States Mexico Canada Agreement (USMCA) to replace NAFTA. South Korea and Japan are reportedly close to similar reciprocal trade agreements. China, which is responsible for 47% of last year’s total trade deficit, is the remaining big holdout.[15]
Jobenomics Prediction for the Year Ahead
U.S. GDP growth in 2019 is likely to be in the mid 2% range, falling short of the Trump Administration’s outstanding GDP accomplishments in 2018. While the President has established the foundation for robust GDP growth in 2019, his aggressive style also spawned a resistance movement that is committed more to overthrowing the current Administration than concentrating on economic and labor force.
The success of the U.S. economy relies on continuous GDP growth that relies on a robust and innovative labor force to produce the goods and services for consumption. For every monthly percentage point change of GDP growth approximately 125,000 jobs are gained or lost. Thus, throughout 2019, 1.5 million jobs are at stake—which is the subject of the next Jobenomics Year Ahead posting “Labor Force Overview.”
Jobenomics concentrates on the economics of business and job creation. The non-partisan Jobenomics National Grassroots Movement’s goal is to facilitate an environment that will create 20 million net new middle-class U.S. jobs within a decade. The Movement has reached an estimated audience of 30 million people. The Jobenomics website contains numerous books and material on how to mass-produce small business and jobs as well as valuable content on economic and industry trends. For more information see Jobenomics.com.
[1] U.S. Bureau of Economic Analysis, GDP, Table 1.1.1, Percent Change From Preceding Period in Real Gross Domestic Product, https://www.bea.gov/iTable/iTable.cfm?reqid=19&step=2#reqid=19&step=3&isuri=1&1921=survey&1903=1
[2] BEA, National Data, GDP, Table 1.1.1. Percent Change From Preceding Period in Real Gross Domestic Product, https://www.bea.gov/iTable/iTable.cfm?reqid=19&step=2#reqid=19&step=3&isuri=1&1921=survey&1903=1,
[3] Federal Reserve Bank of Atlanta, GDPNow, https://www.frbatlanta.org/cqer/research/gdpnow.aspx
[4] Federal Reserve Bank of New York, Nowcasting Report, https://www.newyorkfed.org/research/policy/nowcast
[5] Congressional Budget Office, The Budget and Economic Outlook: 2018 to 2028, April 2018. Summary Figure 1, Growth of Real GDP and Real Potential GDP, Page 2, https://www.cbo.gov/system/files?file=115th-congress-2017-2018/reports/53651-outlook.pdf
[6] Goldman Sachs. GS Macro Outlook 2019, 18 November 2018, https://www.goldmansachs.com/insights/pages/outlook-2019/us-outlook/report.pdf
[7] U.S. Federal Reserve System, Federal Open Market Committee, Economic projections of Federal Reserve Board members and Federal Reserve Bank presidents under their individual assessments of projected appropriate monetary policy, September 2018, https://www.federalreserve.gov/monetarypolicy/files/fomcprojtabl20180926.pdf
[8] U.S. Bureau of Economic Analysis, https://bea.gov/newsreleases/national/gdp/gdpnewsrelease.htm
[9] U.S. Bureau of Economic Analysis, NIPA, Tables, Table 1.1.5, Gross Domestic Product, retrieved 20 April 2018, https://www.bea.gov/iTable/iTable.cfm?reqid=19&step=2#reqid=19&step=3&isuri=1&1921=survey&1903=5
[10] U.S. Bureau of Labor Statistics, Consumer Expenditures (Annual) News Release, Consumer Expenditures 2017, 11 September 2018, https://www.bls.gov/news.release/archives/cesan_09112018.htm
[11] U.S. Bureau of Economic Analysis, NIPA, Tables, Table 1.1.5, Gross Domestic Product, retrieved 20 April 2018, https://www.bea.gov/iTable/iTable.cfm?reqid=19&step=2#reqid=19&step=3&isuri=1&1921=survey&1903=5
[12] U.S. Bureau of Economic Analysis, BEA International Trade and Investment Country Facts, https://apps.bea.gov/international/factsheet/index.cfm
[13] U.S. Bureau of Economic Analysis, 30 July 2018 News Release, Direct Investment by Country and Industry, 2017, https://www.bea.gov/news/2018/direct-investment-country-and-industry-2017
[14] The Commission on the Theft of American Intellectual Property, May 2013 Report and 2017 Update, http://www.ipcommission.org/report/
[15] Jobenomics Year Ahead report includes a future detailed posting on U.S. Trade issues.

