

The United States consistently produced tens of millions of new jobs for six consecutive decades from the 1940s through the 1990s. The bottom fell out in the decade of the 2000s with a net loss of 1 million jobs. Consequently, it is critical that a significant number of new jobs are created this decade and beyond for the U.S. economy to prosper. (Download this Posting)
Total New U.S. Jobs by Decade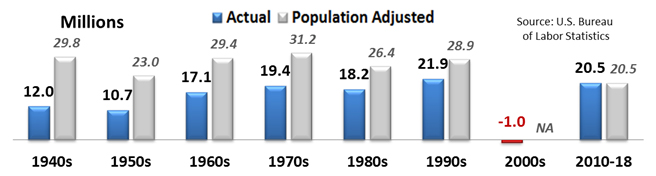
Employment increased by 20.5 million workers from 2010 to 2018, which is a vast improvement over the previous decade that lost 1 million jobs. This level of job creation is on par with the actual job creation numbers in the 1970s, 1980s, and 1990s.
However, adjusting for population growth, 20.5 million falls short of jobs produced from the 1940s through the 1990s. For example, if the 1970s actual rate of 19.4 million is adjusted for population differences (205 million in 1970 versus 329 million in 2018), the adjusted job creation rate in the 1970s becomes 31.2 million. 31.2 million new jobs are 52% greater than the 20.5 million produced so far this decade. However, this decade still has one year left. Assuming 2019 generates 3.0 million new jobs (2018 created 2.6 million new jobs), the new total would be 23.5 million. The 1970s adjusted 31.2 million total would still be 38% higher than the projected 2010s total of 23.5 million.[1]
President Trump’s goal of creating 25 million new jobs over the next decade is a conservative and realistic goal. Production of 25 million new jobs per decade is needed to keep the economy growing, accommodate an expanding population, and to maintain a healthy “natural rate of unemployment” between 4.5% and 5% that allows for industry changes, technological disruption, new labor force entrants and workers the freedom to search for better jobs.
During the first 24-months of the Trump Administration, the President averaged 201,083 jobs per month. In 2017 and 2018, the President averaged 182,333 and 219,833 jobs respectively—a 21% growth rate. If 2019 grows at this growth rate (there is no reason it won’t considering the economy’s current momentum and barring no major disruption[2]), 265,046 jobs per month could be produced for a total of 3.2 million new jobs in 2019, and 23.7 million new jobs this decade (the 2010s).
Job Creation by President
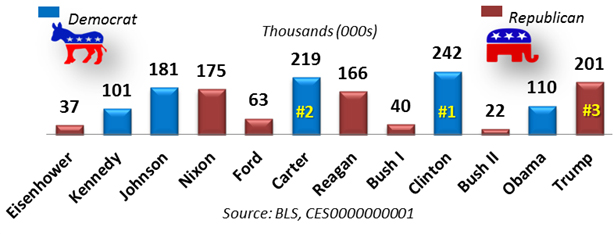
In today’s highly-charged political environment, what people really want to know is how today’s president is performing against past presidents. As color-coded by political party, of the twelve presidents since WWII, President Trump’s average monthly 201,083 job creation rate puts him in third-place following President’s Clinton and Carter actual job creation rates. Adjusted for population size, President Trump would be in sixth place following Carter (325,981), Johnson (313,570), Clinton (305,305), Nixon (282,171), and Reagan (244,575).
From a labor force perspective, employment gains are only half the solution for prosperity. The other half deals with mitigating labor force losses due to unemployment and work-capable people voluntarily departing the workforce to a Bureau of Labor Statistics (BLS) category entitled “Not in the Labor Force.”
Knowing how the BLS defines labor force and accounts for the different labor force categories is essential to understanding labor force statistics and interpreting fact from fiction. The basic concepts involving employment and unemployment are straightforward. A later posting in this Year Ahead report will provide a detailed discussion on understanding government statistics.
The U.S. labor force consists of approximately 250 million citizens (called the civilian noninstitutional population) enrolled in one of three Bureau of Labor Statistics categories: Employed, Unemployed and Not-in-Labor-Force. 5
- People with jobs are Employed.
- People are Unemployed if they do not have a job, have actively looked for work in the prior four weeks, and are currently available for work.
- People who have no job and are no longer looking for a job are classified by the BLS as “not in the labor force” or Not-in-Labor-Force.
From a Jobenomics viewpoint, it is vitally important to evaluate the net effect of all of three categories rather than emphasizing new jobs. For example, increasing the workforce by 25 million new jobs (President Trump’s goal) makes little economic sense if 25 million people voluntarily leave the workforce for welfare and alternative lifestyles outside the traditional labor force. Since the year 2000, the Not-in-Labor-Force grew by 27 million citizens. For this reason, Jobenomics focuses on net labor force gains and losses from all three categories as opposed to the changes in the employment and unemployment categories, which is the focus of most policy-makers and media-pundits.
Working Versus Non-Working Populations
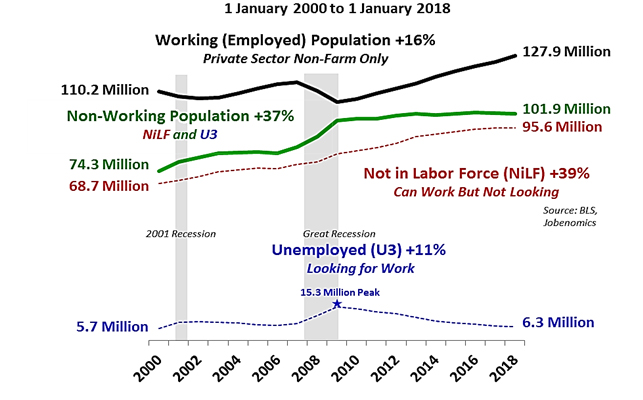
From the year 2000, the private sector Working Population (employed) grew by 16% (from 110.2 million to 127.9 million workers) compared to a Non-Working Population (Unemployed and Not-in-Labor-Force) rise of 37% (from 74.3 million to 101.9 million citizens).
The Not-in-Labor-Force rose by 39% (from 68.7 million in the year 2000 to 95.6 million citizens today), and the number of Unemployed increased 11% (from 5.7 million in the year 2000 to a peak of 15.3 million in 2009 to 6.3 million citizens today). During the Great Recession, the Non-Working Population almost matched the level of the Working Population in 2009. Fortunately, the spread between the Working Population and Non-Working Population is widening, which is a good sign for the economy and labor force. However, policy-makers place too much emphasis on the Unemployed and not enough on the Not-in-Labor-Force cadre, which is 15-times larger. [3]
Sooner or later, the American people will figure out that the current way our government calculates unemployment is flawed. Under the current system, it is theoretically possible for the United States to have a zero rate of unemployment if all unemployed people just quit looking for work and joined those in the Not-in-Labor-Force. To be classified as unemployed, one must be actively looking for work. Frustrated or discouraged Americans who are capable of working but quit looking and voluntarily depart the workforce are accounted in a nebulous Not-in-Labor-Force category that few people comprehend.
Labor Force Gains and Losses Since 2000
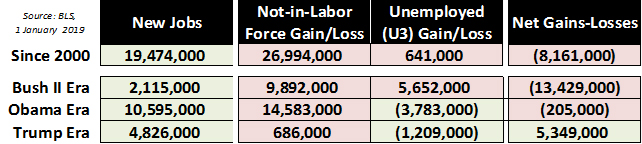
From the beginning of the 21st Century (1 January 2000 to 1 January 2019), the American labor force is weaker by a net 8,161,000 workers. This weakness is exacerbated by a population growth of 47 million additional American citizens present today compared to 2000 (282 million versus 329 million) plus the impact of a rapid rise of contingent part-time workers with a corresponding decrease in traditional full-time workers.
During the 8-years/96-months of the Bush II Era (1 January 2001 through 31 December 2008), the U.S. labor force suffered a devastating net loss of 13,429,000 jobs (2,115,000 new jobs including government, 9,892,000 voluntary workforce departures, and 5,652,000 newly unemployed). To a large extent, President Bush endured the perfect storm of labor force calamities:
- 8-months of the 2001 Recession (March 2001 through November 2001),
- 18-months of Great Recession (December 2007 through June 2009),
- the aftermath of the 9/11 attacks and the ensuing global war on terrorism, and
- nine major Hurricanes (Katrina, Ike, Rita, Wilma, Ivan, Charley, Frances, Jeanne, and Allison) that collectively caused over $275 billion in damage.
During the 8-years/96-months of the Obama Era (1 January 2009 through 31 December 2016), the U.S. labor force net loss was 205,000 jobs, with 10,595,000 entering the labor force, 14,583,000 voluntarily departing, and 3,783,000 fewer people recorded as officially unemployed. It is important to remember that the first 21-months of President Obama’s first term in office, the Administration dealt with the Great Recession and post-recession recovery operations. Obama’s next 75-months in office produced the longest run of consecutive labor gains since WWII when BLS record keeping began. This 75-month run exceeded the previous record of 48-months that occurred from July 1986 to June 1990.
During the 24-months of the Trump Administration, from 1 January 2017 to 1 January 2019, the U.S. labor force net gain amounted to 5,349,000 individuals. 4,826,000 new workers entered the labor force—an average of 201,083 jobs per month. 1,209,000 fewer workers were officially unemployed (people looking for work), and the number of work-capable people in the Not-in-Labor-Force (people who quit looking for work) increased by 686,000 citizens.
Now that the unemployment rate is hovering around historic low percentages, the number of unemployed citizens is not likely to decrease much lower. Consequently, reversing the size and growth of the Not-in-Labor-Force population should be the Trump Administration’s highest workforce priority since this cadre is overwhelmingly the most abundant source for new American workers.
If the Administration cannot entice these sidelined citizens to enter the labor force, the number of unfilled U.S. jobs (currently 6.9 million) is likely to continue to grow unabated to the point that American businesses have to resume outsourcing labor to foreign countries or automate (robotics and artificial intelligence). The only other likely course of action would be to increase the influx of skilled foreign workers via a merit-based immigration system.
Businesses create jobs that produce goods and services (GDP) to satisfy a nation’s needs and wants. Consequently, a healthy business environment is essential to generating new jobs that are essential to fulfilling the demands of a growing population. In comparison to population growth, American businesses are growing today at one-fourth the rate than they did in the 1990s.
Employment versus Population Growth
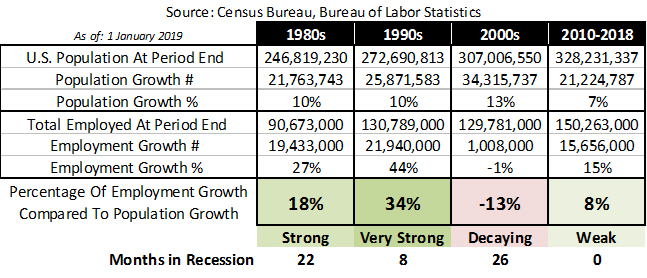
The rate of U.S. job growth far exceeded population growth in the 1980s and 1990s, 18% and 34% respectively. This extraordinary growth expanded the middle class and the belief in the American Dream. It also provided income opportunity for tens of millions of people and cushioned the workforce during 26-months of recession. Then the bottom fell out.
From 2000 to 2009, the U.S. population outgrew the workforce by 13% that was decimated by 26-months of recession. During this era, the U.S. suffered a net loss of approximately 1 million jobs compared to population growth of 34 million people. So far this decade, employment growth outpaced population growth by a meager 8% during a recession-free period that is expected to continue through 2019.
Private sector businesses create the types of jobs that generate economic growth. Big business is the anchor tenant of the U.S. economy. Small businesses are the engine of the economy, employing almost three-quarters of all Americans and creating three-quarters of new jobs this decade. Startup businesses are the seed corn of the future economy. Single-person nonemployer firms are the overlooked segment of the economy. (Note: startups, micro, and small employer businesses and nonemployer firms are discussed in subsequent postings in this Year Ahead report.)
GDP versus Job Growth by Industry This Decade (2010-2018)
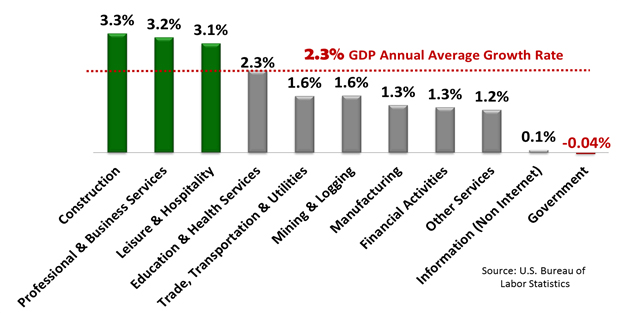
So far this decade, industry employment growth has been lackluster. Only three of the eleven major U.S. supersectors reported by the BLS outperformed the 2.3% annual rate of GDP growth. The manufacturing supersector has been one of the worst performers with an average of 1.3% with the durable goods sector averaging 1.6% and the nondurable goods sector at an abysmal 0.8% this decade. However, during the 24-months of the Trump Administration, manufacturing jobs increased by 4.0% and should go higher if new trade agreements are successful. As discussed in a later posting, Americans should not view manufacturing as a significant source of new jobs due to automation.
From a labor force standpoint, the single biggest issue facing the Trump Administration is shrinking the enormous size (96 million) of citizens in the Not-in-Labor-Force. Shrinking the Not-in-Labor-Force is even more important than creating new jobs. This massive number of sidelined citizens in the Not-in-Labor-Force is a significant problem for a number of reasons.
The first reason is due to this cadre’s immense size. The Not-in-Labor-Force cadre now contains 75% as many people as the entire U.S. private sector workforce (95,649,000 versus 127,858,000) and 1520% the size of the number of employed citizens looking for work (95,649,000 versus 6.294,000).[4]
Second, the BLS reports that only 5% of people in the Not-in-Labor-Force cadre currently “want a job.” The remaining 95% are living by other means including public/familial assistance, retirement income, student loans, or alternative lifestyles in the underground and illicit economies, all of which places a significant strain on taxpaying working Americans.
Job Openings by Industry
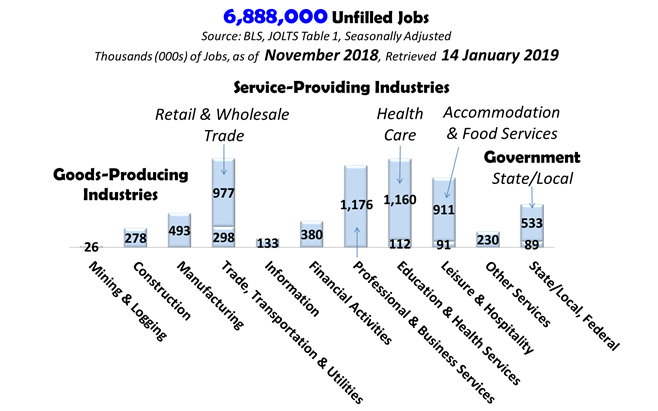
Lastly, the U.S. private sector now produces many more new jobs than they can fill due to a deficit of skilled labor. Skilled personnel in the Not-in-Labor-Force could fill these vacant positions. Per the 8 January 2019 BLS Job Openings and Labor Turnover Summary, 6.9 million open employment positions (one of the highest numbers in U.S. history—August 2018 was the highest with 7.3 million unfilled jobs) remain vacant.[5] To provide a pathway for sidelined citizens to reenter the labor force, the Administration needs to increase its attention on small business creation at the base of the American socio-economic pyramid.
In conclusion, the non-government private sector workforce is the mainstay of the U.S. economy. While growing, this workforce is overly burdened by a nonworking population (unemployed, Not-in-Labor-Force cadre, and people that cannot work).
Maintaining a Large Overhead Destabilizes the U.S. Economy
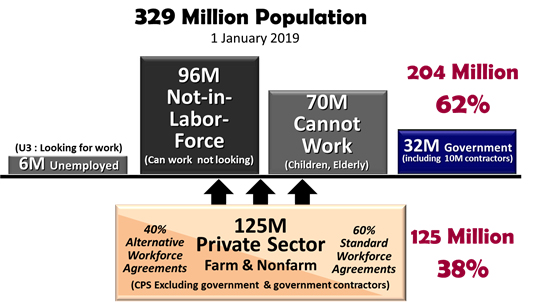
Out of a total population of 329 million Americans, 125 million non-government private sector workers support 32 million government workers and government contractors, 96 million people who can work but chose not to work, 70 million who cannot work (children, elderly and institutionalized citizens), and 6 million unemployed citizens. Of the 125 million private sector workers, approximately 60% are standard full-time workers, and 40% are contingency workers (part-timers, freelancers, independent contractors, etc.) who make substantially lower wages, often with fewer or no benefits than their full-time counterparts.
While recent trends are slowly reversing America’s descent from an economic quagmire of the Great Recession, the U.S. economy is not yet sustainable without the continued strengthening of the U.S. non-government private sector labor force. Excluding an estimated 10 million government contractors in the private sector, the private sector workforce now consists of 117,858,000 workers[6], which represents 38% of today’s total U.S. population of 329,096,000.[7] The U.S. economy is not sustainable over the long-term with only 38% supporting an overhead of 62%.
Jobenomics concentrates on the economics of business and job creation. The non-partisan Jobenomics National Grassroots Movement’s goal is to facilitate an environment that will create 20 million net new middle-class U.S. jobs within a decade. The Movement has reached an estimated audience of 30 million people. The Jobenomics website contains numerous books and material on how to mass-produce small business and jobs as well as valuable content on economic and industry trends. For more information see Jobenomics.com.
[1] U.S. Bureau of Labor Statistics, http://www.bls.gov/webapps/legacy/cesbtab1.htm
[2] As of this writing the partial government shutdown of 800,000 jobs is an example of a potential major disruption. If these workers continue to be paid as currently planned, employment numbers should not be impacted with the exception that the indirect workforce (especially small business) will experience a disruption. A long-term shutdown is a different story. The Mueller Investigation could also upend the Trump Administration’s progress of growing the economy and jobs.
[3] BLS data sources: Total Private, http://www.bls.gov/webapps/legacy/cesbtab1.htm; Not-in-Labor-Force, http://data.bls.gov/timeseries/LNS15000000, and Total U3 Unemployed, http://www.bls.gov/webapps/legacy/cpsatab10.htm
[4] Bureau of Labor Statistics, Not-in-Labor-Force, http://data.bls.gov/timeseries/LNS15000000, and U3 Unemployed, http://www.bls.gov/webapps/legacy/cpsatab10.htm
[5] Bureau of Labor Statistics,
[6] U.S. Bureau of Labor Statistics, Household Data, Summary table A. Household data, seasonally adjusted, https://www.bls.gov/news.release/empsit.a.htm
[7] U.S. Census Bureau, U.S. and World Population Clock, https://www.census.gov/popclock/

