
Labor Force: Employment, Unemployment and Not-in-Labor-Force Assessment. The Jobenomics 2018 U.S. Economic Outlook predicts an equal probability (33.3%) for economic improvement, maintaining the status quo or an economic slowdown in 2018. This assessment is based on a detailed analysis of six strategic considerations: Economy, Business, Labor Force, Governance, Domestic Disruptors and International Disruptors. This posting deals with the outlook for U.S. Employment and job creation. The entire 60-Page Jobenomics 2018 U.S. Economic Outlook report can be downloaded free from the Jobenomics Library.
Jobenomics 2018 U.S. Economic Outlook Matrix
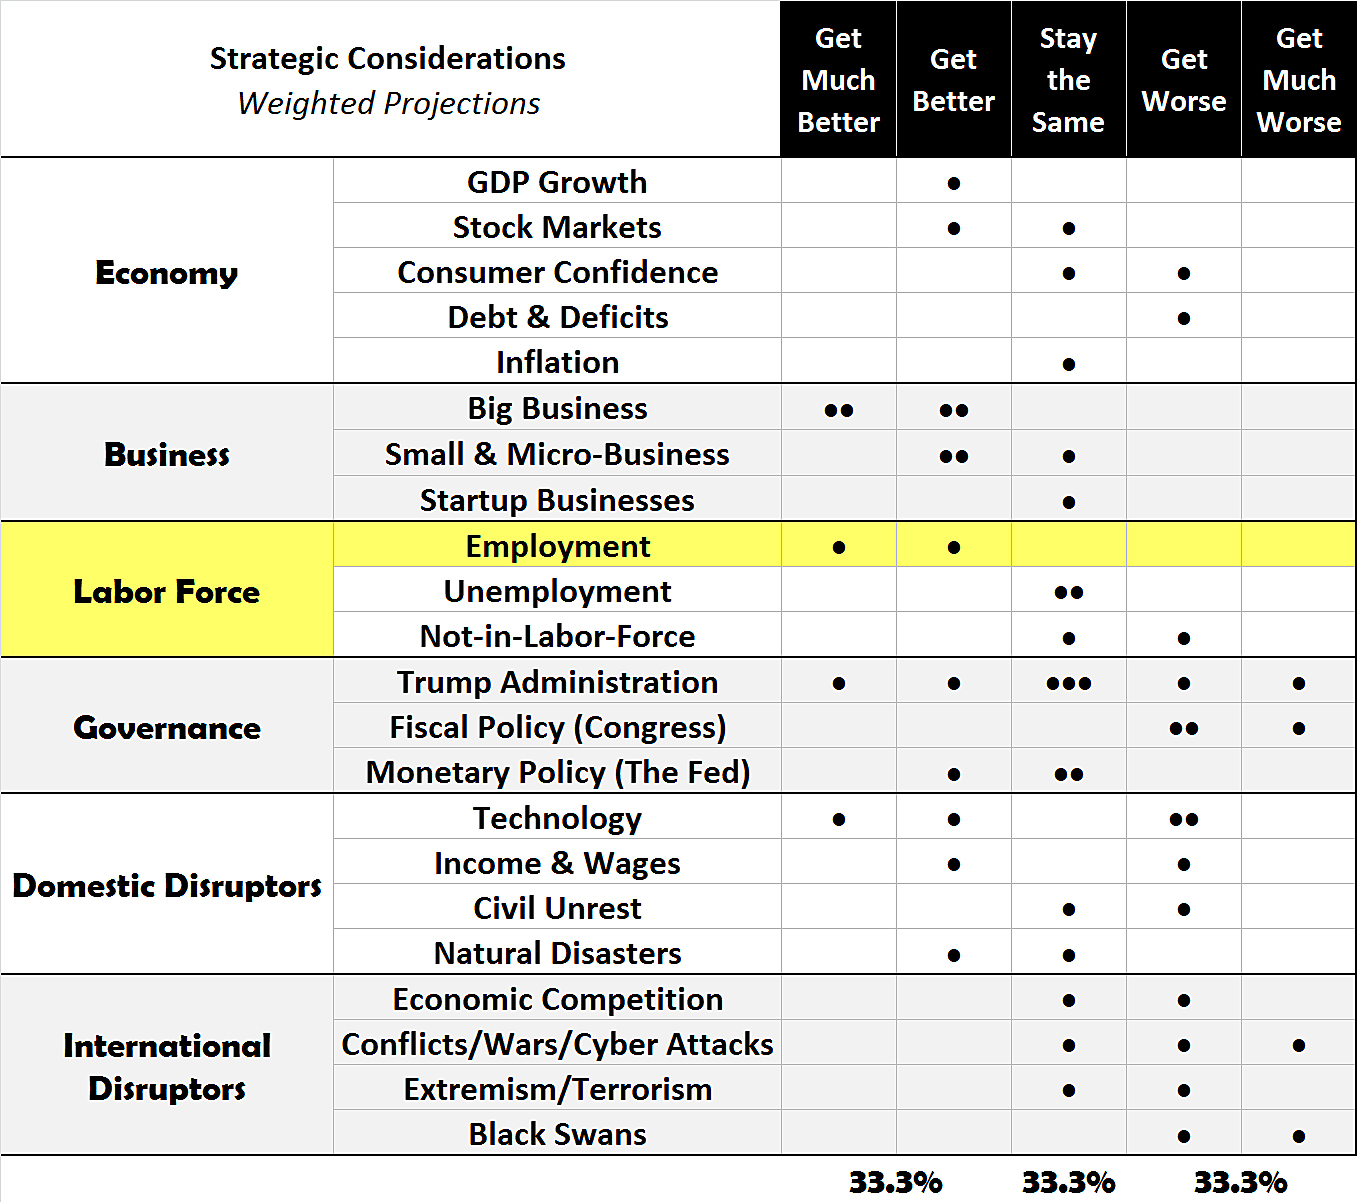
Jobenomics predicts that the number of employed will get better in 2018 but not to the degree advertised by the Administration. If the Administration takes a stronger stance on mass-producing small business and shifting its focus from the traditional economy to the emerging digital economy, Jobenomics believes that the employment situation will get much better in 2018.
Jobenomics Goal: 20 Million Net New Jobs in the Next 10-Years
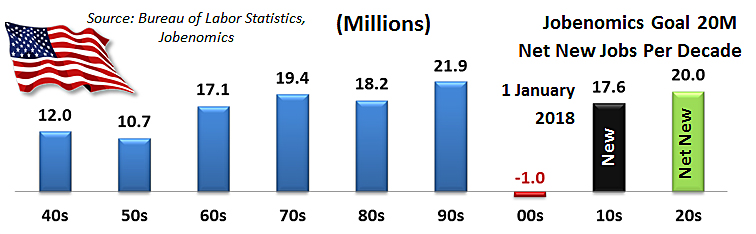
The United States consistently produced tens of millions of new jobs for six consecutive decades from the 1940s through the 1990s. The bottom fell out in the decade of the 2000s with a net loss of one million jobs. Consequently, it is critical that a significant number of new jobs are created for the U.S. economy to prosper.
20 million net new jobs per decade is a goal that has historical precedent. It is the number needed to accommodate new labor force entrants, a growing population, and maintaining an unemployment rate of 5%, which is considered a “normal rate of full” employment.
U.S. employment grew by 17.6 million citizens this decade. At the current rate of growth and barring a financial downturn, the U.S. labor force should gain 21.7 million new jobs by the end of the decade
A basic understanding of three BLS labor force categories is essential to evaluating labor force statistics. According to the BLS, the basic concepts involving employment and unemployment are straightforward. People with jobs are Employed. People are Unemployed if they do not have a job, have actively looked for work in the prior four weeks, and are currently available for work. The Not-in-Labor-Force category includes adults who are capable of working but are not looking for work.
U.S. Labor Force Gains and Losses Since 2000
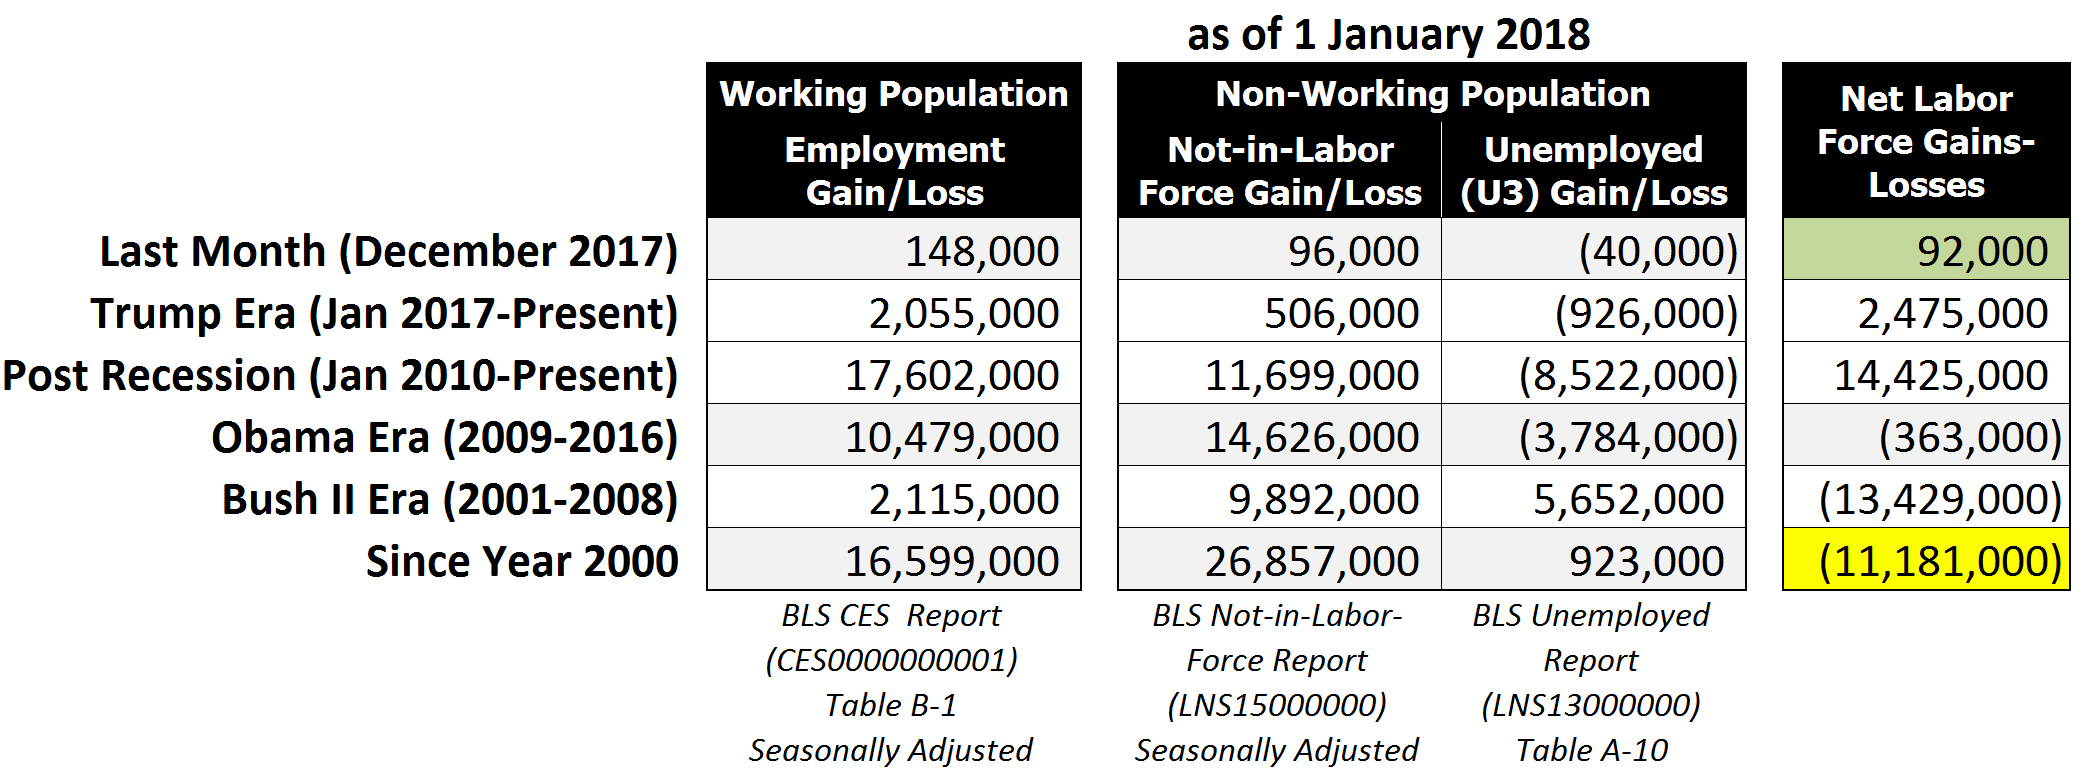
Maintaining a proper balance between these three categories is essential to economic success. The recent improvement in the Employed and Unemployed categories are positive developments. On the other hand, the voluntary departure of able-bodied adults in Not-in-Labor-Force category remains a significant U.S. workforce and economic challenge.
Between 1 January 2000 and 1 January 2018, the number of Employed increased by 16,599,000, the Not-in-Labor-Force category (people who can work but don’t) increased by 26,857,000 citizens, and the Unemployed increased by 923,000. The net result of these changes means the U.S. labor force is weaker today by a net 11,181,000 citizens than it was at the turn of the Century. This weakness is exacerbated by a population growth of 44 million additional American citizens present today compared to the year 2000 (282 million versus 326 million).
Most Americans wrongheadedly assume that a good economy creates jobs. Good jobs build a good economy. Moreover, jobs do not create jobs, businesses do.
Job Gains/Losses By President Since 2001

From 2001 to 2018 (the 17-year/204-month period covering the Bush, Obama, and Trump Administrations), the United States produced monthly job gains 149-times and job losses 55-times. The best month for job gains (524,000) occurred in May 2010. The worst month for job losses (-823,000) occurred in March 2009. The average number of new jobs over this 17-year period was a measly 71,000 job gains per month.
Most economists use a job creation rate standard of 250,000 new jobs per month. This rate supplies enough jobs to the U.S. workforce that will produce enough goods and services to grow GDP. This reasonably high threshold is needed to compensate for months with weak employment gains and during periods of recessions. The United States exceeded the 250,000 benchmark 30-times over the last 17-years, or once in every seven months. Consequently, reaching this job creation threshold is an achievable goal.
From an Administration job creation standpoint,
- The Bush Administration (2001 to 2008) created an average of only 22,000 new jobs per month, due to the onslaught of two major recessions, the calamity of 9/11 and the United States’ expensive mobilization for the global war on terrorism.
- The Obama Administration (2009 to 2016) created an average 109,000 job gains per month. If the six months of the Great Recession that Obama “inherited” was subtracted, the average of the ensuing 90-month period yielded an average of 159,000 new jobs per month. Perhaps, the most important legacy of the Obama Administration is 75-months of consecutive job gains averaging 199,000 jobs per month during a period where the U.S. economy grew at a sclerotic rate of5%. The last 6-years of the Obama Administration, job gains were impressive: 2.1, 2.1, 2.3, 3.0, 2.7, and 2.2 million jobs per year respectively.
- The Trump Administration continued the positive job creation trend with 12 consecutive months of job gains and extended the continuous job creation run to 87 months—the longest span of labor force gains since the Bureau of Labor Statistics began record keeping in February 1939. During his first year in office (2017), the Trump Administration created 2.1 million jobs, averaging 171,000 job gains per month, which is useful but insufficient for the Trump Administrations to create 25 million new jobs over the next decade. To achieve President Trump’s goal of creating 25 million new jobs over the next nine years, the Administration needs to generate an average of 212,454 new jobs per month.
Job Creation 2000 to 2010
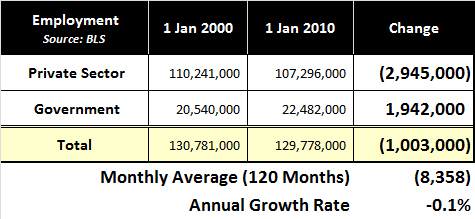
The decade of the 2000s was a particularly lousy decade with negative employment growth due to two recessions that lasted 26-months, the second of which was the 18-month long Great Recession of 2007 to 2009 that precipitated a global financial crisis. During this decade, the U.S. private sector lost almost 3 million jobs, and the U.S. government gained nearly two million jobs, for a net employment loss of slightly over 1 million jobs and a negative annual growth rate of 0.1%.
Jobs Creation 2010 to 2018
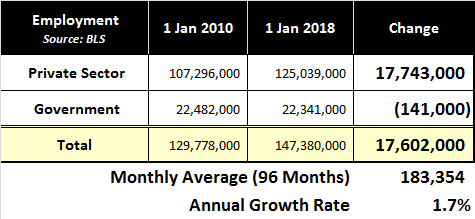
The decade of the 2010s has been slightly better. The most recent 8-year period produced an average yearly job growth rate of 1.7% that was below the 2.2% average annual rate of GDP growth. Since GDP growth largely depends on consumption (a product of growing jobs and wages), poor performance in job growth will eventually drag down GDP to its level. Without job growth, the only ways to stabilize or grow GDP is by increased private sector or government investment (which is unlikely) or eliminating trade deficits (also unlikely).
Jobs Creation 2016 to 2026 
The 24 October 2017 BLS Employment Projections Summary predicts that private sector employment is projected to increase by 11.5 million over the 2016-26 decade, which is substantially below the Trump Administration’s 25 million projection over the next ten years. The BLS also projects an annual GDP growth rate of 2.0% from 2016 to 2026, which is also substantially lower the Administration’s goal of a sustained GDP growth rate of 4.0%.
From a Jobenomics standpoint, labor force growth underpins GDP growth, and such a difference is concerning. The BLS attributes its slow growth rate projection to the decelerating growth of the “civilian noninstitutional population,” which is the combined total of Employed, Unemployed and Not-in-Labor-Force categories. According to the BLS, the civilian noninstitutional population will grow at annual rate of only 0.9% from 2016 to 2026. This growth is slower than previous decades, 1.0% from 2006 to 2016, and 1.3% from 1996 to 2006.
As shown in Table 2.1 of the BLS Employment Projections Summary, the 11.5 million new jobs projection includes 10,527,000 in the seven services-providing industries, 779,000 self-employed, 219,000 in the three goods-producing industries (manufacturing, construction, and mining) and a loss of 6,100 agricultural jobs. Regarding manufacturing, between 2016 and 2026, the BLS projects a manufacturing loss of 736,000 jobs, which is diametrically opposed to the Administration’s efforts to generate millions of high-paying manufacturing jobs.
The BLS Employment Projections Summary was released two months before the enactment of the Tax Cuts and Jobs Act (TCJA). Unfortunately, the TCJA is unlikely to meaningfully close the employment disparity between the BLS and the Administration that it serves.
An analysis of the TCJA by the Tax Foundation, a highly-credible independent nonprofit tax policy institution in Washington DC, estimates that the TCJA create between 339,000 new full-time equivalent jobs, and “if” fully implemented, 1.6 million jobs over the next ten years. House Speaker Paul Ryan estimates that TCJA reforms will help businesses create 890,000 full-time jobs over the next decade. If these assessments are accurate, the TCJA will help generate an insufficient number (between 33,900 and 160,000 per year, or 2,825 and 13,000 jobs per month) of new jobs to close the gap between the BLS and the Administration projections.
To fulfill President Trump’s 25 million job objective, the Administration needs to create an economic and labor force environment that can generate 212,454 new jobs per month over the next nine years. The TCJA is a step in the right direction. Big businesses are likely to add jobs but not enough given the rationale explained earlier in this document. Cutting regulations will help small business job creation, but the level is unknown. Leveling the trade playing field will also help but is unlikely to be implemented in scale anytime soon. What is needed most is a concerted effort to mass-produce startups, expand existing small businesses, and a shift of focus from the traditional economy to the emerging digital economy. If the Administration accomplishes the menu of items in a stable economic environment, Jobenomics believes that the President will reach its job creation goal.
Standby for the next posting on the U.S. Unemployment outlook, or download the entire 60-Page Jobenomics 2018 U.S. Economic Outlook at the Jobenomics Library.
About Jobenomics: Jobenomics deals with the economics of business and job creation. The non-partisan Jobenomics National Grassroots Movement’s goal is to facilitate an environment that will create 20 million net new middle-class U.S. jobs within a decade. The Movement has a following of an estimated 20 million people. The Jobenomics website contains numerous books and material on how to mass-produce small business and jobs as well as valuable content on economic and industry trends. For more information see https://jobenomics.com/.

