
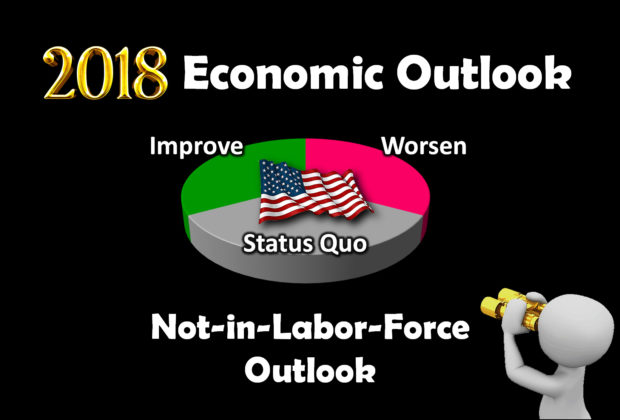
Labor Force: Employment, Unemployment and Not-in-Labor-Force Assessment. The Jobenomics 2018 U.S. Economic Outlook predicts an equal probability (33.3%) for economic improvement, maintaining the status quo or an economic slowdown in 2018. This assessment is based on a detailed analysis of six strategic considerations: Economy, Business, Labor Force, Governance, Domestic Disruptors and International Disruptors. This posting deals with the outlook for the U.S. Not-in-Labor-Force cadre of people that can work but do not work. The entire 60-Page Jobenomics 2018 U.S. Economic Outlook report can be downloaded free from the Jobenomics Library.
Jobenomics 2018 U.S. Economic Outlook Matrix
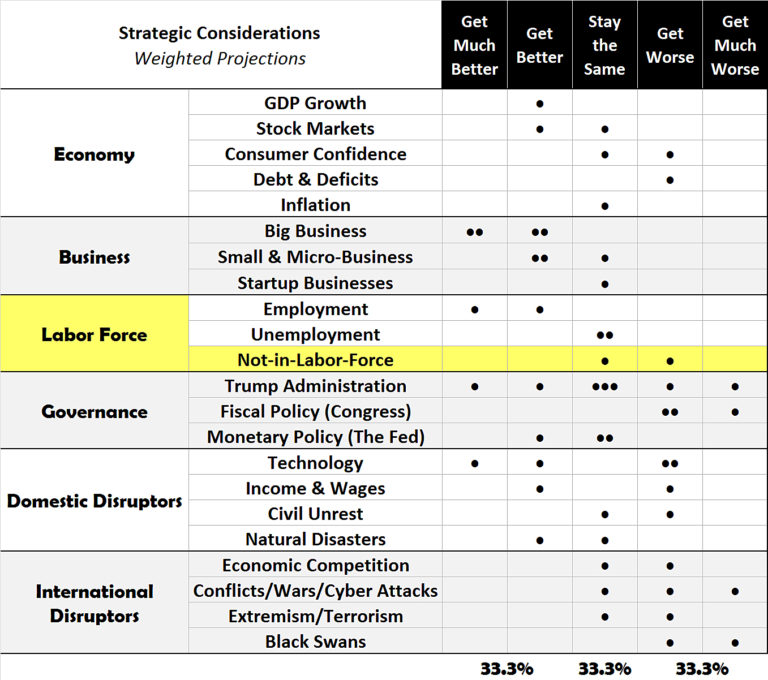
The Not-in-Labor-Force cadre, a U.S. Bureau of Labor Statistics (BLS) category for citizens who can work but chose not to work, is likely to stay the same or get worse in 2018 due to the lack of high-skilled labor in proportion to industry demand.
A basic understanding of three BLS labor force categories is essential to evaluating labor force statistics. According to the BLS, the basic concepts involving employment and unemployment are straightforward. People with jobs are Employed. People are Unemployed if they do not have a job, have actively looked for work in the prior four weeks, and are currently available for work. The Not-in-Labor-Force category includes adults who are capable of working but are not looking for work.
U.S. Labor Force Gains and Losses Since 2000

Maintaining a proper balance between these three categories is essential to economic success. The recent improvement in the Employed and Unemployed categories are positive developments. On the other hand, the voluntary departure of able-bodied adults in Not-in-Labor-Force category remains a significant U.S. workforce and economic challenge.
Between 1 January 2000 and 1 January 2018, the Not-in-Labor-Force category (people who can work but don’t) increased by 26,857,000 citizens, the Employed increased by 16,599,000, and the Unemployed increased by 923,000. The net result of these changes means the U.S. labor force is weaker today by a net 11,181,000 citizens than it was at the turn of the Century. This weakness is exacerbated by a population growth of 44 million additional American citizens present today compared to the year 2000 (282 million versus 326 million).
The explosive growth of people in the Not-in-Labor-Force Category is one of the most severe challenges facing American economic growth today. Woefully, little is being done to address this problem. Jobenomics foresees a minimal change in 2018 and may even worsen as lower-skilled workers become increasingly frustrated and voluntarily leave the workforce for alternative lifestyles and dependency on public assistance.
Not-in-Labor-Force Growth Since 2000
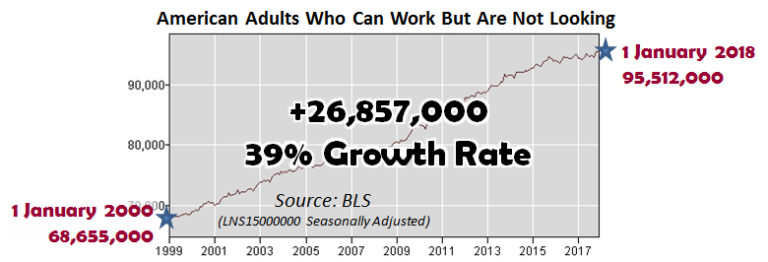
Over the last 18-years, the Not-in-Labor-Force category (a BLS category that includes adults who are capable of working but are not looking for work) has grown at an incredible rate (39%) and number of citizens (26,857,000).
Labor Force Trends Since Year 2000

Using official U.S. government data, this chart puts the rapid Not-in-Labor-Force growth into perspective. Labor force trends since the year 2000 indicate that percentage-wise, the Not-in-Labor-Force grew at the fastest rate (39%), followed by U3 Unemployed (16%) and Total Employed (14%). Numbers-wise, the Not-in-Labor-Force increased by 26.9 million people, followed by Total Employed growth of 19.5 million and U3 Unemployed growth of 0.9 million people. The U.S. economy is not sustainable as long as the unemployment and voluntary departure rates exceed people entering the labor force.
Not-in-Labor-Force citizens tend to remain unemployed much longer—often for life—than the unemployed who are actively seeking employment. Even more mind-boggling is the statistic that 95% of the Not-in-Labor-Force BLS survey respondents say that they “do not want a job now.”
Economists divide unemployment into two broad categories of voluntary unemployment and involuntary unemployment. Voluntary unemployment refers to individuals who leave their jobs willingly in search of other employment. Involuntary unemployment involves fired or laid off personnel who have to look for another job.
These categories can be further subdivided into “frictional unemployment” (in-between jobs), “cyclical unemployment” (related to business cycles during recessionary periods and periods of economic growth), and “structural employment” (loss of jobs due to lack of jobs at the going wage rate or the lack of employable skills). Jobenomics adds a fourth category called, “functional unemployment,” which includes the Not-in-Labor-Force (not looking for work) and the Unemployed (looking for work).
The ability to work should be the determining factor for unemployment as opposed to whether or not a person is looking for work. Jobenomics contends that all Americans capable of working, regardless if they are looking or not, should be considered “Functionally Unemployed.” Jobenomics defines “functional” as capable of operating or working. A functional adult who is capable of working but chooses not to work should be considered unemployed for the same reason that “discouraged,” “marginally attached” and “part-time workers for economic reasons” are included in the BLS U4, U5, and U6 unemployment categories.
“Functional” Unemployment
If calculated against the entire U.S. population, the Functional Unemployment rate would be 33%, which is significantly higher than the advertised 4.1% U3 or 8.1% U6 unemployment rates.
Jobenomics would not eliminate the old U-Rate system but institute a reporting system based on population and the capability to work. By focusing on functional unemployment (U6 and Not-in-Labor-Force), as opposed to U3 unemployment, policy-makers and the American public could make better decisions regarding labor force participation, tax revenue generation and entitlement/welfare expenditures.
The BLS should also consider reporting unemployment rates as a percentage of the entire U.S. population as opposed to the Civilian Labor Force, which is an arbitrary percentage based on the willingness to work or to look for work.
U3, U6 & NiLF Functional Unemployment
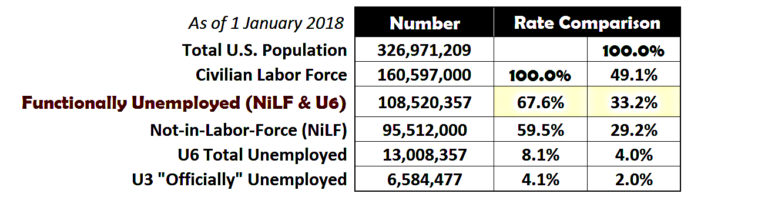
Using current BLS methodology, the Functional Unemployed rate would equate to 67.6% of the Civil Labor Force. Percentages calculated a percentage of the population would make the Functional Unemployment rate 33.2%. Comparing Americans who are capable of working with the overall society would be a better economic metric regarding the strength of the labor force and the ratio of the working versus non-working population.
The Census Bureau and the Bureau of Labor Statistics provide limited insight into why people are not in the labor force. According to a BLS spokesperson, “Our survey is designed to measure work and looking for work. We do not focus on people outside of the labor market.” One should not perceive this spokesperson’s comment as trite but as factual.
The BLS was established in 1884 during the advent of the Industrial Revolution to collect information on labor employment. Despite its many attempts to expand its statistical analysis beyond the traditional thirteen vertical industrial supersectors, the BLS has been unable to obtain approval and sufficient funding to explore in-depth analysis of the Not-in-Labor-Force. Other similar areas that need more empirical data and analysis include the Contingent Workforce and the Digital Economy—both of which are transforming the U.S. economy and labor force.
Current BLS methodology also provides limited visibility in crosscutting industries like the Healthcare supersector, a sector that anecdotally represents upwards of 18% of the U.S. economy, and the Energy supersector. For the record, Jobenomics applauds the BLS for the timely and quality information that they provide. With a marginal amount of additional resources, the BLS could present macroeconomic data and analysis that would elevate policy- and decision-making to a more strategic level.
A major reason for the Not-in-Labor-Force growth is due to the exponential growth and financial attractiveness of U.S. welfare and social programs. While there is no evidence that people on welfare are immune to work, there is evidence that many recipients often lack the skills necessary to obtain the types of jobs that pay above-average wages, which, in turn, makes welfare and means-adjusted social benefits attractive. According to a CATO Institute study, “the current (U.S.) welfare system provides such a high level of benefits that it acts as a disincentive for work.” Furthermore, hundreds of federal, state and local welfare and social assistance programs have created a culture where beneficiaries have a “PhD-level” of understanding how to obtain a subsistence level income, which often requires non-reportable income derived in the underground economy.
Unfortunately, American policy-makers and their constituents have polar opposite views regarding welfare and social program expenditures that consume about 63% of mandatory spending of the U.S. federal budget. Jobenomics foresees that there is little chance of compromise between the two camps on cutting federal spending. However, there seems to be universal agreement on the need to grow the economy. Increasing sustained GDP growth of 3% or higher would provide financial resources to ensure safety-nets for the poor as well as investment resources for small business and job creation—the focus of the Jobenomics National Grassroots Movement—at the base of the United States’ socioeconomic pyramid.
Another primary reason for the Not-in-Labor-Force growth is due to the ever-increasing number of students enrolled in postsecondary education. Government subsidized postsecondary education is a means-tested welfare program for people that cannot otherwise afford a college education.
Jobenomics endorses subsidized postsecondary education for the right reasons such as, to land the right job at a livable wage, to self-actualize and to achieve economic self-sufficiency. Unfortunately, too many students use government subsidies to enroll in postsecondary institutions for the wrong reasons, such as parental or peer pressure, enjoying the college scene, or delaying the drudgery of work.
Subsidized postsecondary education is not free. Consequently, many students are burdening themselves with a lifetime of long-term debt. According to the U.S. Department of Education’s Federal Student Aid Portfolio Summary, outstanding student loans reached an all-time high of $1.37 trillion in 2017, up from $0.52 trillion in 2007. The total number of outstanding federal student loan borrowers also reached an all-time high record of 42.6 million borrowers in 2017, up 28.3 million borrowers from in 2007.55F87F
Based on historical data, the number of postsecondary students in the Not-in-Labor-Force will continue to increase at a rate of 7% to 8% per year. Student loan debt will also continue to grow and compound.
The Not-in-Labor-Force challenge is especially acute in low-income inner-city communities. Over the last decade, at the invitation of local officials, this author visited over 100 cities and met with thousands of policy-makers, community leaders, and business-execs regarding the Jobenomics economic, community, small business and workforce development concepts. These communities included large cities (e.g., Detroit, Atlanta, New York City), small cities (e.g., Erie, Durham, Wilmington), and highly-distressed urban areas (e.g., West Baltimore, Austin Chicago).
Low-Income Inner-City Communities
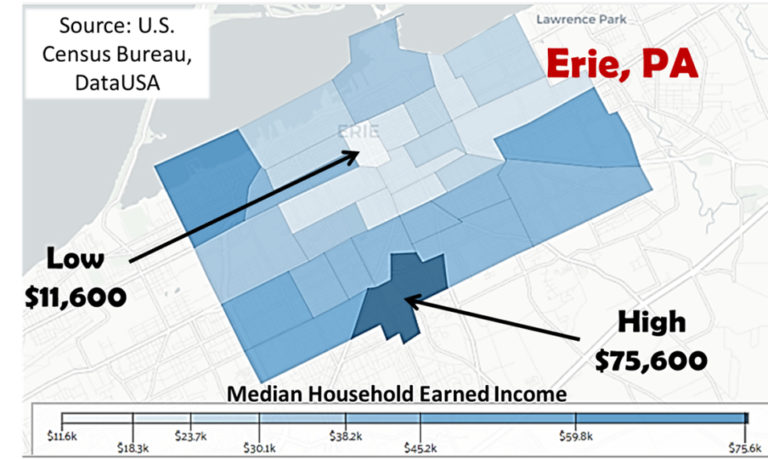
Erie, Pennsylvania, a midsized city of 100,000 residents, serves as an example of one of Jobenomics inner-city initiatives. The median household earned income within Erie’s inner-city is a mere $11,600 as opposed to a $75,600 less than a mile away. This low level of income produces poverty, hopeless, and a bounty of other social ills like drug use, gangs and crime. A downloadable 50-page Jobenomics-Erie is available. Jobenomics Erie’s program goal is to create hundreds of micro-businesses that will produce 3,500 new direct jobs with livable wages and viable long-term career opportunities over the next five years.
Traditional economic development specialists concentrate on well-resourced and high-skilled communities. Jobenomics economic development approach focuses on less-resourced and lower-skilled communities. Traditional specialists advocate business incubators to find silver bullet technologies that will create substantial enterprises and business accelerators that provide mezzanine financing to an existing business to take them to the next level. Jobenomics advocates community-based business generators to mass-produce highly-scalable startups at the base of the U.S. socioeconomic hierarchy. Jobenomics contends that America needs a combination of incubators, accelerators, and generators for economic and labor force growth.
The solution to mass-producing jobs in less-resourced and lower-skilled communities starts with establishing a skilled-based training and certification program in a community-based business generator. To date, Jobenomics is working with over a dozen cities to mass produce micro-businesses and jobs with an emphasis on inner-city minorities, veterans, women, new workforce entrants and other hopefuls who want a job. For more information, download from the extensive Jobenomics research library that contains volumes of material on economic, community, small business, and workforce development.
Standby for the next postings on the U.S. Governance (White House, Congress and the Fed), or download the entire 60-Page Jobenomics 2018 U.S. Economic Outlook at the Jobenomics Library.
About Jobenomics: Jobenomics deals with the economics of business and job creation. The non-partisan Jobenomics National Grassroots Movement’s goal is to facilitate an environment that will create 20 million net new middle-class U.S. jobs within a decade. The Movement has a following of an estimated 20 million people. The Jobenomics website contains numerous books and material on how to mass-produce small business and jobs as well as valuable content on economic and industry trends. For more information see https://jobenomics.com/.

