
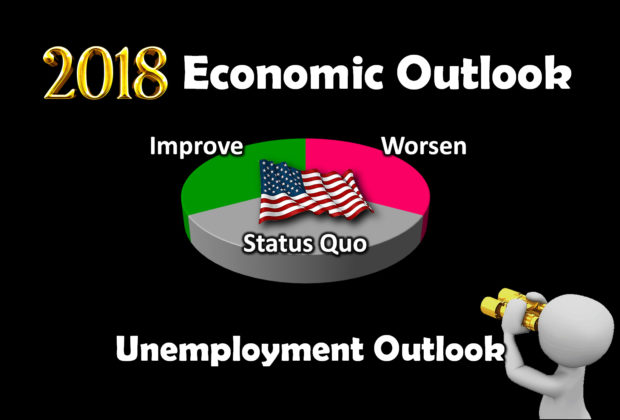
Labor Force: Employment, Unemployment and Not-in-Labor-Force Assessment. The Jobenomics 2018 U.S. Economic Outlook predicts an equal probability (33.3%) for economic improvement, maintaining the status quo or an economic slowdown in 2018. This assessment is based on a detailed analysis of six strategic considerations: Economy, Business, Labor Force, Governance, Domestic Disruptors and International Disruptors. This posting deals with the outlook for U.S. Unemployment. The entire 60-Page Jobenomics 2018 U.S. Economic Outlook report can be downloaded free from the Jobenomics Library.
Jobenomics 2018 U.S. Economic Outlook Matrix
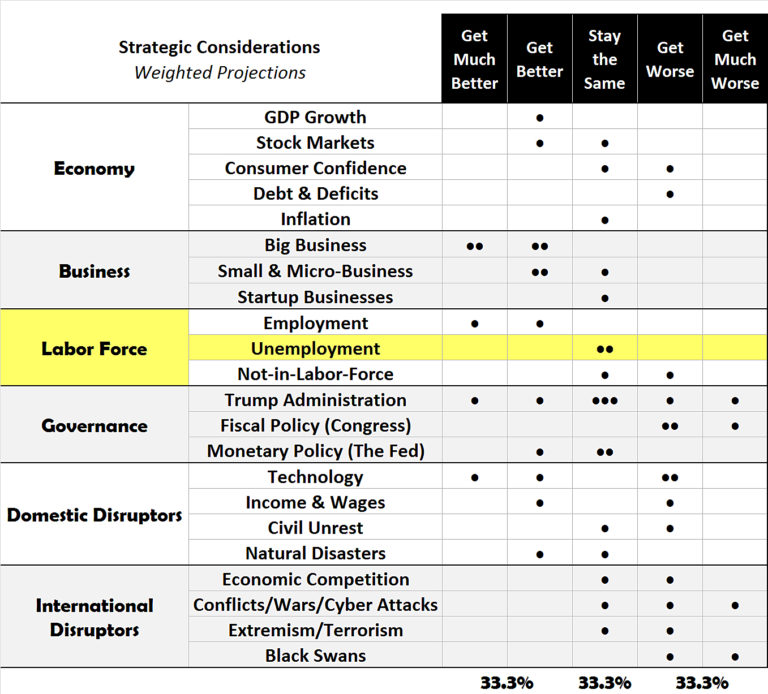
Jobenomics predicts that the official U3 Unemployment Rate will remain at its post-recession low for 2018 barring unexpected events or a financial downturn.
A basic understanding of three BLS labor force categories is essential to evaluating unemployment statistics. According to the BLS, the basic concepts involving employment and unemployment are straightforward. People with jobs are Employed. People are Unemployed if they do not have a job, have actively looked for work in the prior four weeks, and are currently available for work. The Not-in-Labor-Force category includes adults who are capable of working but are not looking for work.
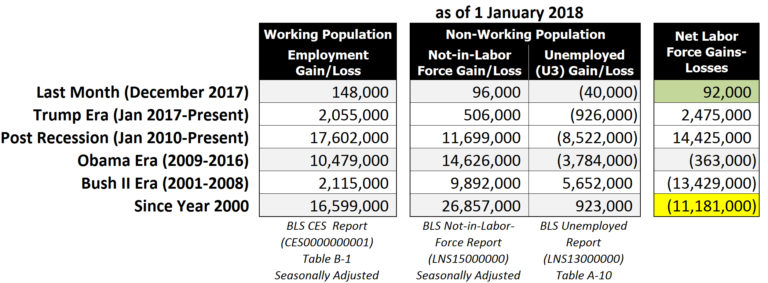
U.S. Labor Force Gains and Losses Since 2000
Maintaining a proper balance between these three categories is essential to economic success. The recent improvement in the Employed and Unemployed categories are positive developments. On the other hand, the voluntary departure of able-bodied adults in Not-in-Labor-Force category remains a significant U.S. workforce and economic challenge.
Between 1 January 2000 and 1 January 2018, the number of Unemployed increased by 923,000, the Not-in-Labor-Force category (people who can work but don’t) increased by 26,857,000 citizens, the number of Employed increased by 16,599,000. The net result of these changes means the U.S. labor force is weaker today by a net 11,181,000 citizens than it was at the turn of the Century. This weakness is exacerbated by a population growth of 44 million additional American citizens present today compared to the year 2000 (282 million versus 326 million).
Jobenomics projects that the official U3 Unemployment Rate will remain unchanged in 2018 from its current post-Great Recession low of 4.1% in December 2017—a rate not seen since February 2001. From a historical unemployment rate perspective, the post-WWII low was 2.5% in June 1953, followed by 3.4% in May 1969, and 3.8% in April 2000.
Historical Unemployment Rate (U3) History Since WWII
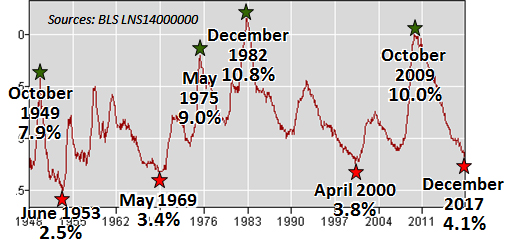
Unemployment rates have been highly volatile over the last fifty years. The official U3 unemployment rate peaked shortly after WWII and declined to a historical low within a decade. Subsequent peaks happened in the early 1960s, mid-1970s after the OPEC oil shock, and the 1980s after the tech boom bubble broke, which set the all-time U3 rate peak of 10.8% in December 1982. During the go-go decades of the 1990s and 2000s, the unemployment rate stayed relatively low until the Great Recession that commenced in December 2007 and ended in June 2009. Due to the Great Recession, the unemployment rate soared to a peak of 10.0% and then gradually dropped to 4.1% today, a low not seen since February 2001.
U3 Unemployment Rate by Age, Sex, Race & Ethnicity
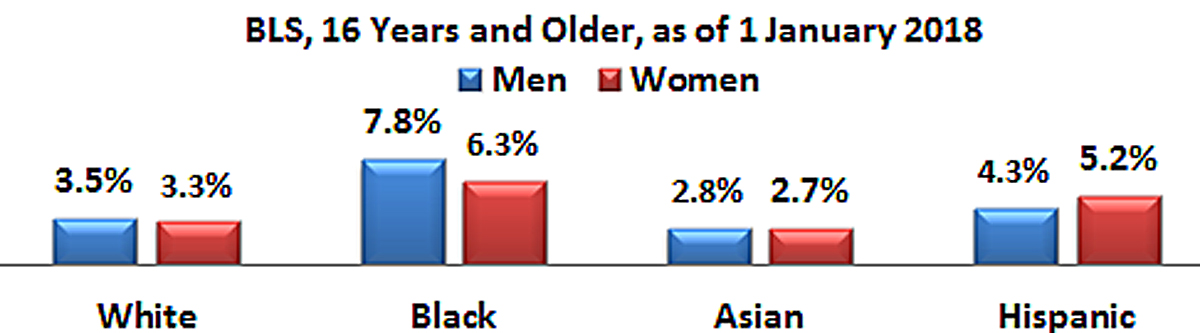
This chart depicts current U3 unemployment statistics by sex, race, and ethnicity. Black and Hispanic Americans are more likely to be unemployed than White or Asian Americans. White and Black males are more likely to be unemployed than their female counterparts. Asian and Hispanic females are more likely to be unemployed than their male counterparts. As a group, Blacks were the most unemployed with a top unemployment rate of 7.8% for Black men and 6.3% for Black women. Over the last year, the unemployment rate for Black men dropped by 0.9% and Black women by 1.0%. Hopefully, this trend will continue.
U3 Unemployment Rate by Age: Both Sexes
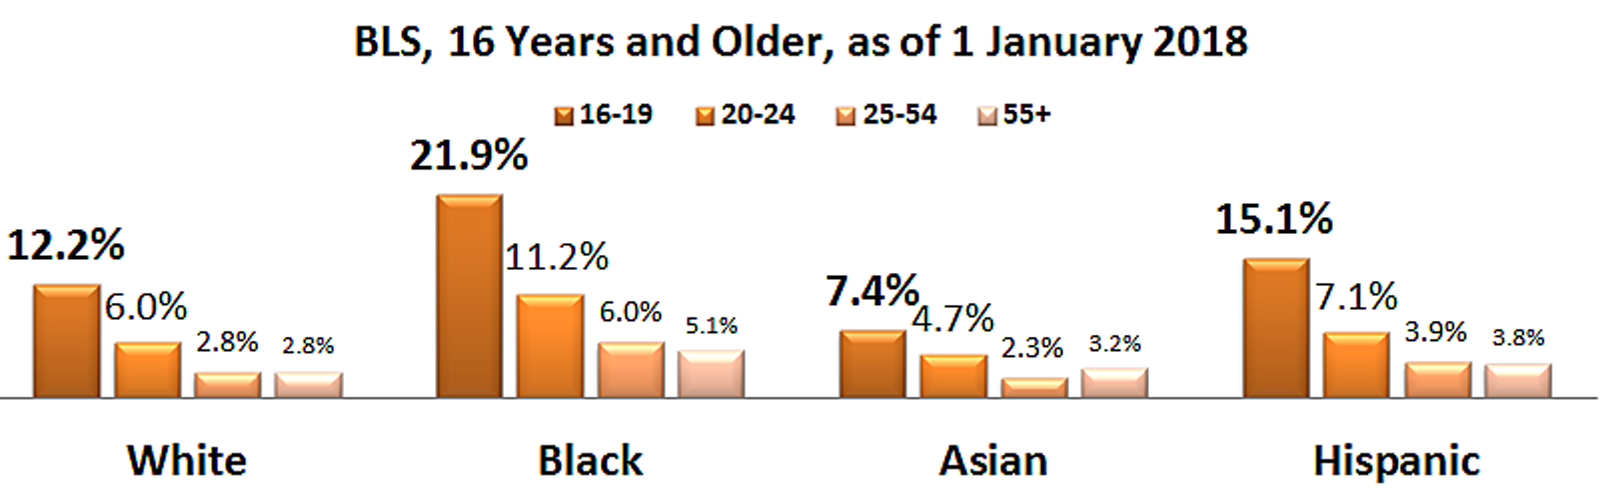
Younger Americans in all age groups are more likely to be unemployed as opposed to older Americans. Unemployment rates for youth aged 16 to 19 are four times higher than the national average.
From a Jobenomics perspective, the United States has more of a youth unemployment problem than a total unemployment challenge. If the 16 to 19 year old group engaged in productive activities (education, training, public service or employment), the U3 unemployment rate would likely be reduced, not only for this age group but later groups as these youth mature.
From an overall labor force perspective, the U3 rate is a relatively weak indicator and undeserving of the amount of attention it receives. The official U3 employment rate is a somewhat artificial percentage since it depends on people “actively looking” for work. Once an individual quits looking, regardless of the reason, they are placed in the Not-in-Labor-Force category.
Few Americans know that is theoretically possible for the United States to have a zero rate of unemployment if all unemployed people just quit looking for work and joined those in the Not-in-Labor-Force. Under the current BLS survey, if unemployed respondents answered “no” to any of the following four BLS survey questions, the United States can have an instantaneous zero rate of unemployment.
- “do you want a job?”
- “have you worked in the last 4-weeks?”
- “have looked for a job in the last 12-months?”
- “would you take a job if offered?”
Consequently, the U3 unemployment rate is a manipulatable metric and an inconsequential macroeconomic indicator of the strength of the U.S. economy.
Other Unemployment & Not-in-Labor-Force Categories
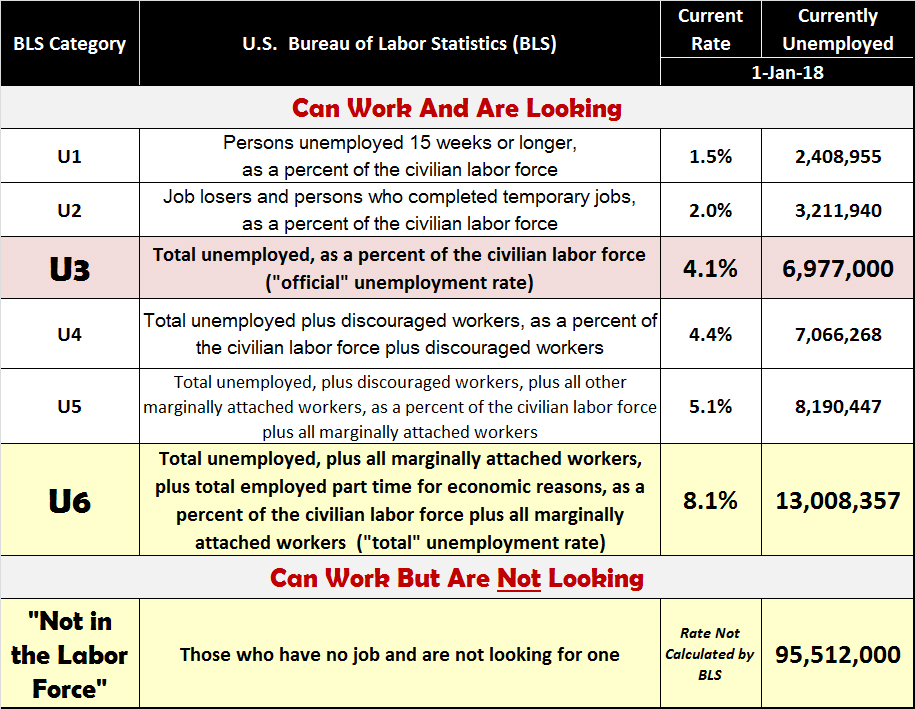
As shown, six Unemployment categories (from U1 Long-Term Unemployed to U3 Officially Unemployed to U6 Total Unemployed and Underemployed) are reported monthly by the BLS. The BLS also calculates the number of adults that can work but are not looking for work in a category entitled Not-in-Labor-Force. Not-in-Labor-Force (95,512,000) is 14.5-times the size of U3 Unemployed (6,584,477) and 7.3-times the size of U6 Unemployed (13,008,357). Therefore, the Not-in-Labor-Force exerts much greater strain on the U.S. economy than does U3 and U6 Unemployment—a fact largely ignored by macroeconomists and policy-makers.
Standby for the next posting on the U.S. Not-in-Labor-Force category, or download the entire 60-Page Jobenomics 2018 U.S. Economic Outlook at the Jobenomics Library.
About Jobenomics: Jobenomics deals with the economics of business and job creation. The non-partisan Jobenomics National Grassroots Movement’s goal is to facilitate an environment that will create 20 million net new middle-class U.S. jobs within a decade. The Movement has a following of an estimated 20 million people. The Jobenomics website contains numerous books and material on how to mass-produce small business and jobs as well as valuable content on economic and industry trends. For more information see https://jobenomics.com/.

