

Executive Summary: The U.S. Bureau of Labor Statistics (BLS) Employment Situation Summary stated that in April 2017 the United States produced 211,000 new jobs. The ADP National Employment Report summary reported 177,000 new jobs. Both numbers are below the 250,000 monthly new job threshold set by most economists. In regard to unemployment situation, the BLS reported 146,000 less people “officially unemployed”, which was offset by 162,000 voluntary departures from the labor force to alternative lifestyles or public assistance. Last month’s labor force situation experienced a net gain of 195,000 workers (211,000 + 146,000 – 162,000), which is positive sign for the economy. Moreover, the first four months of the Trump Administration produced more net labor force gains (1,938,000) than the Obama Administration’s 8-year record of a net labor force loss of 486,000 and the GW Bush Administration’s net labor force loss of 2,125,000.
Notwithstanding poor BLS March and tepid April job creation figures, overall labor force performance for the first 4-months of 2017 reflected a positive start for the new Trump Administration with the creation of 738,00 new jobs plus a reduction of 473,000 unemployed and 727,000 voluntary departures to the U.S. labor force. It is important to remember that to be recorded as unemployed one must be looking for work. If one quits looking, they are recorded as “not in the labor force” – a separate BLS category. Consequently, reducing the non-in-the-labor-force rolls which simultaneously reducing the unemployment rolls is something extraordinary in recent labor force history.
On the other hand, President Trump’s “bold plan to create 25 million new American jobs in the next decade and return to 4 percent annual economic growth” was dealt a major setback with the 28 April 2017 U.S. Bureau of Economic Analysis “advance” estimate that GDP increased only at an annual rate of 0.7% in the first quarter of 2017. From a Jobenomics standpoint, President Trump’s bold plan is an achievable goal but fraught with significant challenges as addressed in detail in the Jobenomics 130-page, 20-part series entitled “President Trumps New Economy Challenge.”
Data Analysis and Discussion. The two primary sources for U.S. labor force data are the monthly U.S. Bureau of Labor Statistics (BLS) Employment Situation Summary, a monthly summary of all U.S. government and private sector employment, and the ADP National Employment Report, a monthly survey of employment by 400,000 U.S. private sector businesses by the ADP Research Institute in collaboration with Moody’s Analytics.
To get a strategic perspective of the state of the U.S. labor force and workforce issues facing the United States, one must compare the Working Population (Employed) against the Non-Working Population (Unemployed and Not-in-Labor-Force).
Working Versus Non-Working Populations
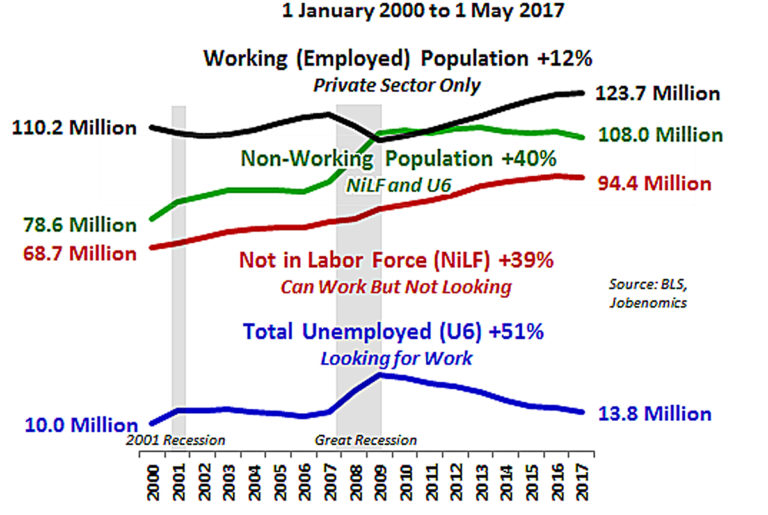
As shown, from 1 January 2000 to 1 May 2017, the Working (Employed) population rose by 12% compared to the Non-Working Population rise of 40%. Jobenomics defines the Non-Working Population as Not-in-Labor Force (that rose by 39%) and Total Unemployed (which is still 51% higher today than year 2000). If these trends continue, Jobenomics predicts that the U.S. Not-in-Labor-Force will equal the Employed population by the mid-2020s, or sooner if the United States suffers a major financial crisis. While the United States posted slow but steady gains during the post-recession era, the U.S. labor force is still 12,030,000 weaker today in terms of gainfully employed workers. It is also important to note that today’s weakened labor force statistics is not adjusted for population growth of 43 million additional Americans compared to year 2000 (282 million versus 325 million).
President Trump’s vision of a “dynamic and booming economy” ultimately depends on mass-producing business, especially small business, creation in order to generate tens of millions of million net new jobs and substantial GDP growth over the next decade.
Real GDP Quarterly Percent Change This Decade

Most economists believe that economic growth depends on employment and GDP growth. The ideal rate for U.S. GDP growth is around 3%. Any GDP growth below 2% is considered sclerotic growth that makes the U.S. economy vulnerable to financial downturns. According to the Bureau of Economic Analysis (BEA), during the post-recession recovery period from Q1 2010 through Q1 2017, U.S. GDP averaged 2.06%. In 2015 and 2016, U.S. GDP grew by subpar rates of 1.9% and 2.0%. Q1 2017’s GDP advanced estimate (initial) was an abysmal 0.7%—setback for the new Trump Administration. Notwithstanding, the Federal Reserve Bank of Atlanta’s GDPNow forecasting model for Q2 2017 is far more optimistic at 4.3%. However, it is important to note the Fed’s GDPNow forecasting model for last quarter’s forecast was 3.1% at the beginning of Q1 2017 (2 February) and continually decreased to 0.2% by the end of the reporting period (28 April). As referred by the Fed, the “Blue Chip Economic Indicators” surveys of leading business economists forecast a much more moderate Q2 2017 growth projection of only 2.6%.
President Trump’s economic vision includes doubling U.S. GDP growth to the 3.5% to 4.0% range according to his economic plan. He has also selected capable business and financial executives for his cabinet to make this vision a reality—this reality ultimately depends on business, especially small business—growth in order to generate goods and services necessary to grow GDP.
While GDP growth does not insure employment growth, sclerotic GDP growth discourages business hiring, consumer spending and labor force expansion. Sclerotic GDP growth also discourages lower rates of unemployment and voluntary workforce departures. Negative GDP growth creates recessions and depressions depending on the severity and longevity of the contracting economy.
The period of sclerotic GDP growth from 2000, has dramatically impacted the American middle-class and the U.S. labor force that gained only 15,077,000 workers compared to the loss of 25,558,000 citizens who are officially unemployed and voluntarily departed the labor force. For most American workers, real wages (purchasing power) have not increased for decades and are not projected to improve anytime soon. America’s aggregate household income has shifted from middle-income to upper-income households, causing many middle-class workers to leave the workforce altogether.
The solution to avoid a financial crisis is to accelerate GDP growth, which requires the creation of more productive private sector jobs, which, in turn, can only be generated by a massive expansion of the small business sector.
Historical Perspective of U.S. Labor Force Gains and Losses Since 2000
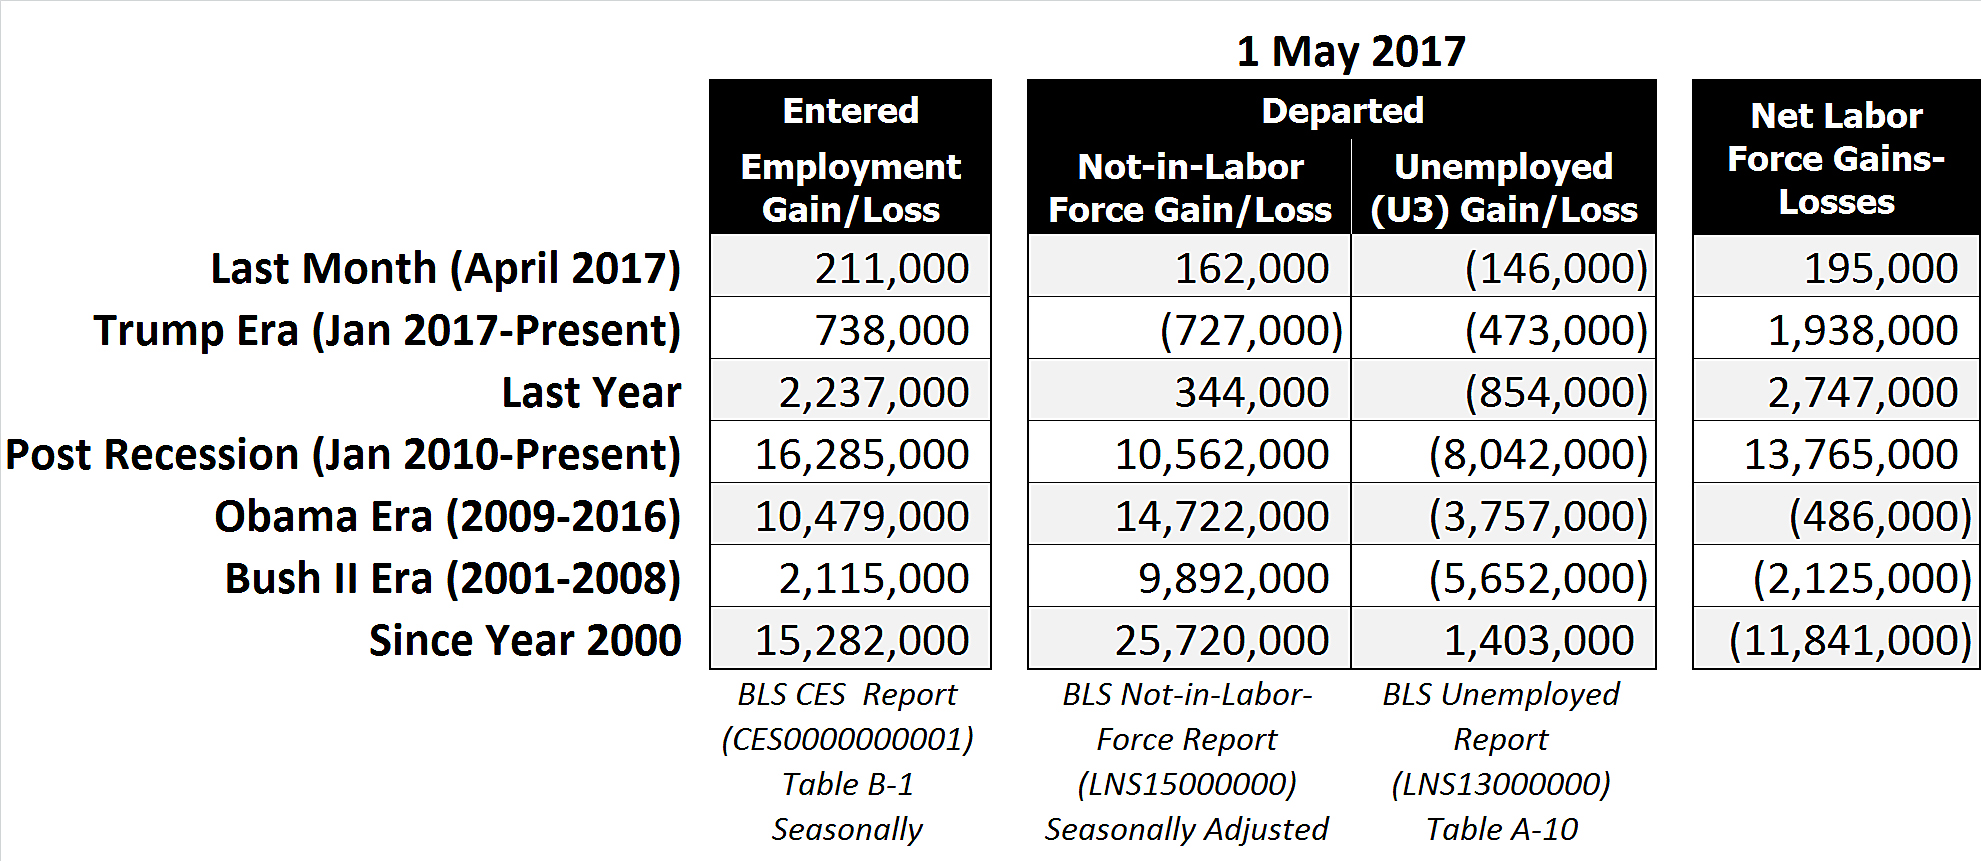
The Bureau of Labor Statistics (BLS) Employment Situation Summary reported that last month (April 2017), 211,000 Americans entered the U.S. labor force, 162,000 more Americans were recorded in the BLS’ “Not-in-Labor-Force” category (a category reserved for able-bodied Americans who choose not to work and voluntarily depart the workforce), and 146,000 less citizens were categorized as officially unemployed, for a net workforce gain of 195,000 Americans—overall a positive report.
From a Trump Era perspective, BLS data indicates that over the four three months (January, February, March and April) of the Trump presidency, the labor force gains were 738,000 (an average of 184,400 per month), which is below the expected threshold of 250,000 jobs per month). However, what is particularly impressive regarding President Trump’s labor force statistics is the drop of 727,000 people in the “not in the labor force” category (i.e., capable of working but not looking) in concert with a drop of 473,000 enrolled in the U3 unemployment category. Apparently, the new Administration is giving people a reason to rejoin the workforce. Moreover, the first four months of the Trump Administration produced 1,938,000 net labor force gains (738,000 + 727,000 + 473,000 = 1,938,000) than the entire Obama Administration’s 8-year record of a net labor force loss of 486,000 and the GW Bush Administration’s net labor force loss of 2,125,000.
Since the end of the Great Recession, during the 88-month period from 1 January 2010 to 1 May 2017, the U.S. labor force net gain was 13,765,000 workers, or an average of 156,200 per month. 16,285,000 entered the labor force, 10,562,000 voluntarily departed, and 8,042,000 fewer people were recorded as officially unemployed.
During the 8-years/96-months of the Obama Era (1 January 2009 to 31 December 2016), the U.S. labor force lost a net 486,000 jobs. 10,479,000 entered the labor force, 14,722,000 voluntarily departed, and 3,757,000 fewer people were recorded as officially unemployed. It is important to remember that President Obama took office during the last 6-months of Great Recession.
During the 8-years/96-months of the GW Bush Era (1 January 2001 to 31 December 2008), the U.S. labor force lost a net 2,125,000 jobs, which included the first 12-months of Great Recession, the 8-months of the 2001 Recession (March 2001–November 2001), as well as the aftermath of the September 11, 2001 attacks. 2,115,000 entered the labor force, 9,892,000 voluntarily departed, and 5,652,000 fewer people were recorded as officially unemployed.
From the beginning of 21st Century (1 January 2000 to 1 April 2017), the American labor force is weaker by 11,841,000 since the advent of the new century not including for population growth of 43 million or the influx of about 3 million new undocumented immigrants. As of 1 May 2017, the BLS reports that the private sector workforce consists of 123,723,000 workers or only 38% of the total population of 325 million. Of the 123,723,000 private sector workers, approximately 60% (74 million) traditional full-time workers and 40% (50 million) are contingent workers (part-timers, freelancers, independent contractors, etc.) who generally-speaking earn far less income than traditional workers and often receive little or no benefits.
ADP National Employment Report Data and Discussion. The April 2017 ADP National Employment Report, released on 3 May 2017, reported 177,000 private sector new jobs. Note 211,000 new jobs reported by the BLS include 17,000 new government workers and 194,000 new private sector jobs.
U.S. Private Sector Employment by Company Size
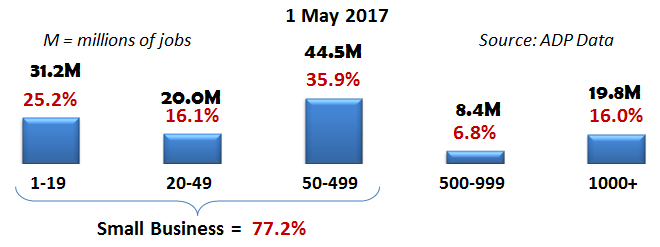
As reported by the ADP National Employment Report, small businesses are undeniably the dominant employer and job creator in the United States. According to ADP, small businesses with less than 500 employees employ 77.2% of all private sector Americans with a total of 95,621,721 employees—over 3.4-times the amount of large businesses with more than 500 employees that have 28,162,205 employees. Micro and self-employed businesses with 1-19 employees employ 1.6-times the number of major corporations with over 1,000 employees (31,159,668 versus 19,785,301).
U.S. Private Sector Jobs Created This Decade by Company Size
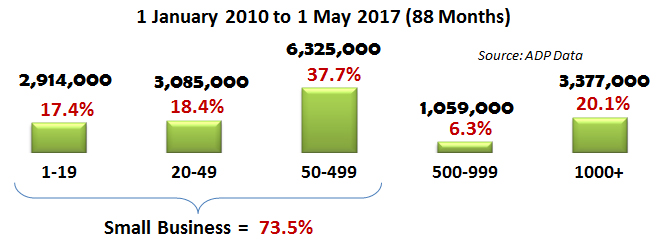
Since the beginning of this decade, small businesses created 73.5% of all new jobs in the United States. Small businesses with less than 499 employees created 2.8-times more jobs as large businesses with over 500 employees, or 12,323,647 versus 4,436,270 new jobs respectively.
U.S. Private Sector Jobs Created Last Month by Company Size
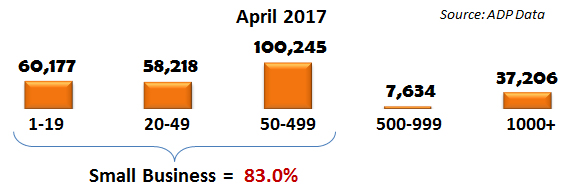
Last month (April 2017), U.S. small business created 83.0% of all new U.S. jobs. While most of the America’s and the world’s attention is focused on the Trump Administration’s big business focus (e.g., reshoring jobs and trade policies), it is small business that produced 218,640 (83%) out of the record 218,640 new private sector jobs last month, whereas, despite all the political rhetoric and media attention, big business (500+ employees) created only 44,840 new jobs.
Concluding Thoughts. According the nonpartisan Congressional Budget Office’s 2017 to 2027 Budget and Economic Outlook report, “over the next five years, the monthly increase in nonfarm payroll employment, which is estimated to average 160,000 jobs in the first half of 2017, is projected to settle down to an average of 64,000 jobs.” If the CBO outlook is correct, the next decade is likely to produce only 9 million jobs, which is far short of President Trump’s projection of 25 million new jobs. Note: last year’s BLS Employment Projections: 2014-24 Summary report forecasts that the United States will produce only 9.9 million new jobs over the next decade.
Jobenomics tends to agree with the CBO and BLS for the reasons discussed in the Jobenomics 130-page, 20-part series entitled President Trumps New Economy Challenge. However, the Trump Plan can be amended to ameliorate the CBO and BLS projected shortfalls. With proper leadership, the Administration can lift tens of millions of Americans out of poverty by making the following four structural changes to President Trump’s economic and job creation plan:
- Balancing the old traditional standard industrial economy with the newly emerging nonstandard digital economy,
- Mitigating the mass-exodus of able-bodied workers who are voluntarily departing the U.S. labor force for lives of dependency or alternative lifestyles,
- Addressing the challenge of the ever growing contingency workforce that will soon be the dominate form of labor in the United States, and
- Mass-producing small and self-employed businesses—the engine of the U.S. economy—and the employer of the vast majority of Americans.
If the Trump Administration can achieve a sustainable 4% GDP in a stable global economy, Americans and the world will be euphoric. This feat will not be easy. The last year the United States breached 4% in a single year was 2001. The last time that the United State reached 4% over ten consecutive years over the last 50-years was never (3.5% was the highest from 1976 to 1985). If the Trump Administration can tie the 3.5% record over the next decade, they will be vindicated and worthy of much praise. The Federal Reserve’s latest projection for U.S. economic growth is between 1.5% and 2.4% during the next four to five years.
Like citizens from Missouri, most American’s now claim the “Show-Me” sobriquet. To date, Jobenomics has not seen adequate evidence from President Trump that the new Administration will be able to achieve his Administration’s lofty, but greatly needed, economic and job creation goals. To this end, Jobenomics published a 20-part series (130-pages) on President Trump’s New Economy Challenge that is available to subscribers or purchase.
About Jobenomics: Jobenomics deals with economics of business and job creation. The non-partisan Jobenomics National Grassroots Movement’s goal is to facilitate an environment that will create 20 million net new middle-class U.S. jobs within a decade. The Movement has a following of an estimated 20 million people. The Jobenomics website contains numerous books and material on how to mass-produce small business and jobs. For more information, see Jobenomics Overview.

