

The March 2018 U.S. Bureau of Labor Statistics and ADP Research Institute reports indicated that the United States created only 103,000 and 241,000 new jobs respectively. Both figures are below the 250,000 new job threshold advocated by most economists. As reported by the Bureau of Economic Analysis, quarterly GDP growth declined to 2.9% in Q4 2017 from a high of 3.2% in the previous quarter. For Q1 2018, the Federal Reserve now predicts a further GDP downturn to 2.3%. Consequently, the U.S. economy is not yet gaining sufficient momentum to achieve President Trump’s goal of creating 25 million new jobs and sustained 4% GDP growth over the next decade. To achieve this worthy and important goal, the Administration must spend more time on small, micro and startup business creation, with emphasis on the emerging digital economy. Download free 13-page report at Jobenomics Library.
Monthly Job Creation Rate By President Since WWII
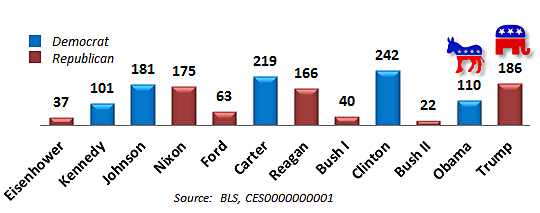
In today’s highly-charged political environment, what people really want to know is how today’s president is performing against past presidents. As color-coded by political party, of the twelve presidents since WWII, President Trump’s average monthly job creation rate is 186,200, which puts him in third-place following President’s Clinton and Carter.
Job Creation Scoreboard Since 2001
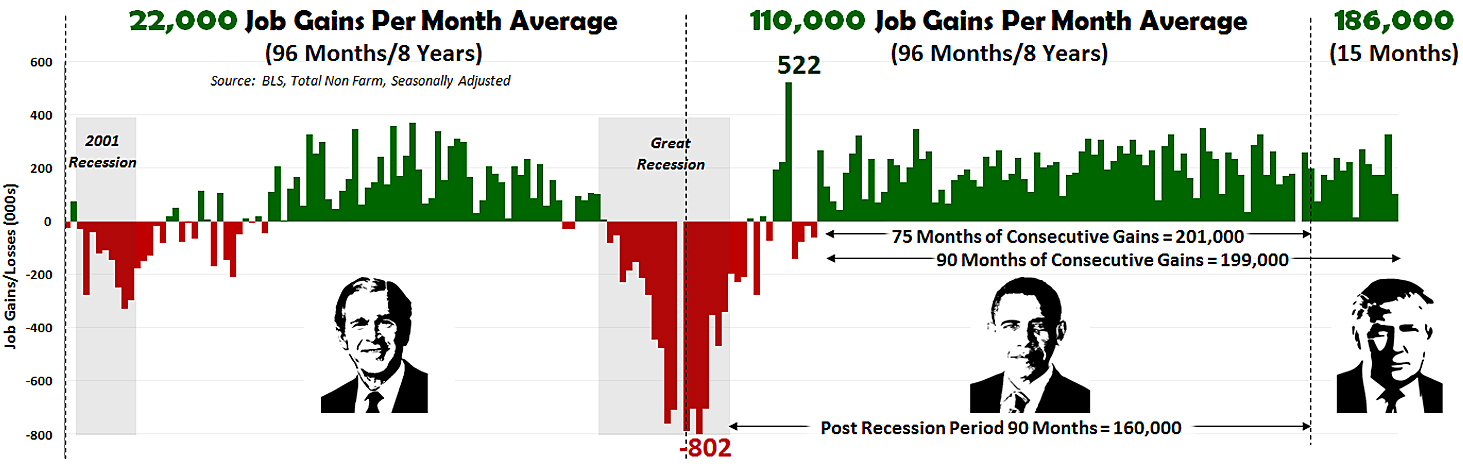
Since 2001, the monthly job creation high water mark was 522,000 new jobs in May 2010, and the low water mark for jobs losses was 802,000 in March 2009. From January 2001 through March 2018, the United States averaged an abysmal 75,000 new jobs per month (not shown).
From an Administration standpoint,
- The Bush Administration (2001 to 2008) created an average of only 22,000 new jobs per month, due to the onslaught of two major recessions, the calamity of 9/11 and the United States’ expensive mobilization for the global war on terrorism.
- The Obama Administration (2009 to 2016) created an average 110,000 job gains per month. Subtracting the six months of the Great Recession that Obama “inherited” from the previous administration, the average job creation rate during the 90-month post-recession period yielded an average of 160,000 new jobs per month. Perhaps, the most important legacy of the Obama Administration is 75-months of consecutive job gains averaging 201,000 jobs per month.
- The Trump Administration continued the positive job creation trend with 15 consecutive months of job gains and extended the continuous job creation run to 90 months—the longest span of labor force gains since the Bureau of Labor Statistics began record keeping in February 1939.
As mentioned, the Trump Administration is averaging 186,200 job gains per month, which is good but roughly equal to the 199,000 monthly average of the 90-month job creation run. Unfortunately, 186,200 per month is insufficient for the Trump Administration to achieve the President’s 25 million new job goal over the next decade (120 months). To accomplish this goal, the Administration needs to generate an average of 211,495 new jobs per month for the remaining 105 months in the decade since President Trump was elected. Consequently, March’s 103,000 new job posting is a setback for the Administration.
A 250,000 jobs per month threshold is a reasonable standard to use to provide a safeguard against future downturns or minor recessions. During the recent 90-month run of consecutive job gains, the United States exceeded the 250,000 job threshold 22-times or nearly one out of every four months. Unfortunately, the number of big (250K+) monthly employment gains is on the decline as shown. Hopefully, the Administration’s tax cuts will motivate increased hiring in the near future.
Big (250K+) Monthly Employment Gains Since 2001

As a note of caution, the Bureau of Labor Statistics employment statistics reported above were “seasonally adjusted” figures. Seasonal adjustment is a statistical technique that attempts to measure and remove the influences of predictable seasonal patterns to reveal how employment and unemployment change from month to month.
Seasonally Adjusted Versus Not Seasonally Adjusted
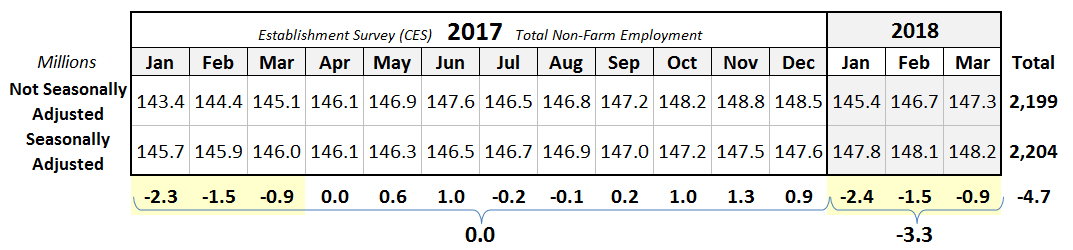
The Seasonally Adjusted Versus Not Seasonally Adjusted chart shows the wide gap between actual and altered numbers. In 2017, the gap between Seasonally Adjusted and Not Seasonally Adjusted numbers reconciled themselves by the end of the year out of a total of 148 million employees. For the three two months in 2018, Seasonally Adjusted figures are 3,264,000 higher than the unadjusted (actual) numbers. The same seasonal disparities occurred in previous years (2017, 3.2 million higher, and 2016, 3.0 million). Consequently, it likely that the wintertime “bump-up” generated early in 2018 may dissipate later in the calendar year.
Jobenomics Analysis of the State of the U.S. Economy and Labor Force.
To fully understand net labor force gains and losses, Jobenomics uses two primary sources of U.S. labor force data:
- The monthly U.S. Bureau of Labor Statistics (BLS) Employment Situation Summary, a monthly summary of all U.S. government and private sector employment, and
- The ADP National Employment Report, a monthly survey of workers in 400,000 U.S. private sector businesses by the ADP Research Institute in collaboration with Moody’s Analytics.
Jobenomics Analysis of the BLS Employment Situation Summary Report.
6 April 2018, the Bureau of Labor Statistics reported that the U.S. labor force added 103,000 new jobs, and the unemployment rate remained unchanged at 4.1%. The change in total nonfarm payroll employment for January was revised down from 239,000 to 176,000, and the change for February was revised up from 313,000 to 326,000, for a net loss of 50,000 jobs.
From a Jobenomics standpoint, employment statistics are important measures of economic growth, but only as a prelude to net labor force gains and losses.
The U.S. labor force consists of approximately 250 million citizens (called the civilian noninstitutional population) enrolled in one of three Bureau of Labor Statistics categories: Employed, Unemployed and Not-in-Labor-Force. From a Jobenomics viewpoint, it is vitally important to evaluate the give-and-take between each of these categories as opposed to emphasizing each individually. For example, increasing the labor force by 25 million new jobs (Trump’s plan) makes little economic sense if 25 million people voluntarily leave the workforce for welfare and alternative lifestyles as has happened in the recent past.
Since the beginning of the 21st Century (1 January 2000), 17.4 million people entered the workforce as opposed to 26.7 million voluntary workforce departures of Americans capable of working—not including population growth of 45 million additional Americans (282 million in 2000 versus 327 million today). If these trends continue, the U.S. economy will eventually collapse due to the financial burden of the non-working population. Fortunately, current trends are positive, but a financial downturn could easily reverse our economic situation.
Working Versus Non-Working Populations

This graph presents a strategic perspective of the U.S. the civilian noninstitutional population covering the period from 1 January 2000 to 1 April 2018.
Before and during the Great Recession, the Non-Working Population (unemployed citizens looking for work and citizens capable of working but not looking for work) was growing at a rated that it almost matched the level of the private sector Working (Employed) Population in 2009. Fortunately, the spread between the Working Population and Non-Working Population is now widening, which is a good sign for the U.S. economy and labor force.
The private sector produces the vast majority of goods and services that drive economic growth. Since the turn of the 21st Century, the U.S. private sector’s Working (Employed) population rose by 14% compared to a 37% rise in the Non-Working Population. Jobenomics defines the Non-Working Population as Not-in-Labor-Force that rose by 39%, and the Officially U3 Unemployed, which is still 16% higher today than it was in the year 2000.
U.S. Labor Force Gains and Losses Since 2000

The 6 April 2018 BLS Employment Situation Summary reported that the U.S. economy generated 103,000 new jobs in March 2017. For the sixth straight month, the official unemployment rate (U3 rate) remained unchanged at 4.1% even though the unemployment rolls shrank slightly by 121,000. Most importantly, and least reported by the media, is that the Not-in-Labor-Force cadre of sidelined citizens increased by 323,000. The combined effect of a weak employment boost, a sizable increase in sidelined Not-in-Labor-Force cadre and a minor decrease in the number of unemployed yielded a net labor force loss of 99,000 citizens.
During the first 15-months of the Trump Administration, employment gains amounted to 2,793,000 workers, for an average of 186,200 per month. Correspondingly, the U3 Unemployment category decreased by 917,000 personnel, and the Not-in-Labor-Force category grew by 329,000 citizens. Consequently, the overall Trump Administration net labor force gain was 3,381,000 citizens. In comparison, during the 8-years/96-months in Obama Administration, the net labor force loss was 247,000 citizens. During the 8-years/96-months in GW Bush Administration, the net labor force loss was 13,429,000 citizens.
Since the end of the Great Recession, from 1 January 2010 to 1 April 2018, the U.S. labor force net gain was 15,440,000 workers. 18,449,000 new workers entered the labor force. 8,516,000 fewer workers were listed as officially unemployed, but the number of work-capable people in Not-in-Labor-Force increased by 11,522,000 citizens.
During the 8-years/96-months of the Obama Era (1 January 2009 through 31 December 2016), the U.S. labor force lost a net 247,000 jobs, with 10,595,000 entering the labor force, 14,626,000 voluntarily departing, and 3,784,000 fewer people recorded as officially unemployed. It is important to remember that the first 21-months of President Obama’s first term in office, the Administration dealt with the Great Recession and post-recession recovery operations. Obama’s next 75-months in office produced the longest run of consecutive labor gains since WWII when BLS record keeping began. This 75-month run exceeded the previous record of 48-months that occurred in the July 1986 to June 1990.
During the 8-years/96-months of the Bush II Era (1 January 2001 through 31 December 2008), the U.S. labor force suffered a devastating net loss of 13,429,000 jobs (2,115,000 new jobs, 9,892,000 voluntary workforce departures, and 5,652,000 newly unemployed). To a large extent, President Bush endured the perfect storm of labor force calamities:
- 8-months of the 2001 Recession (March 2001 through November 2001),
- 13-months of Great Recession (December 2007 through December 2008),
- the aftermath of the 9/11 attacks and the ensuing global war on terrorism, and
- nine major Hurricanes (Katrina, Ike, Rita, Wilma, Ivan, Charley, Frances, Jeanne, and Allison) that collectively caused over $275 billion in damage.
From the beginning of the 21st Century (1 January 2000 to 1 April 2018), the American labor force is still weaker by a net 10,171,000 workers (highlighted in light red). This weakness is exacerbated by a population growth of 45 million additional American citizens present today compared to 2000 (282 million versus 327 million) plus the impact of a rapid rise of contingent part-time workers with a commensurate decrease in traditional full-time workers.
To sum up, while recent trends are slowly reversing America’s descent from an economic quagmire, the U.S. economy is not yet sustainable without the continued strengthening of the U.S. private sector labor force. The private sector workforce consists of 125,904,000 workers, which represents only 38% of the total U.S. population of 327,450,761 as of 1 April 2018. Of this workforce, approximately 60% are traditional full-time workers, and 40% are contingent workers (part-timers, freelancers, independent contractors, etc.) who earn far less income than conventional workers and often receive little or no benefits. Policy-makers and decision-leaders must concentrate on small business creation and sustainment to achieve economic and labor force growth.
Jobenomics Analysis of the ADP National Employment Report.
The March 2017 ADP National Employment Report, released on 4 April 2018, states that the U.S. non-farm private sector created 241,000 new jobs, which is 138,000 less than the 103,000 new jobs reported by the BLS Employment Situation Summary that includes 102,000 new non-farm private sector and 1,000 government new jobs. ADP does not report on government employment, unemployment or workforce departures as does the BLS.
Of the 241,000 U.S. non-farm private sector new jobs reported by ADP, small businesses (1-49 employees) gained 47,000 jobs, medium businesses (50-499 employees) gained 127,000 new jobs, and large companies (500+ employees) gained 65,000 new jobs. Micro-businesses (1-19 employees) gained 35,000 compared to 54,000 Macro-businesses (1000+ employees), or 65%, which is a historically low percentage.
Service-providing industries created 176,000 jobs and the goods-producing sector 65,000 jobs. Of the ten private sector industries, Professional/Business Services generated 44,000 new jobs, followed by Trade/Transportation/Utilities (40,000), Construction (31,000), Manufacturing (29,000), Education/Health Services (28,000), Leisure & Hospitality (26,000), Financial Activities (18,000), Other Services (17,000), Natural Resources & Mining (5,000) and Information (3,000).
For this report, Jobenomics classifies “small business” as having 1-499 employees (the definition supported by the U.S. Small Business Administration), medium-sized business as 500-999 and large businesses as 1000+ employees. Also, Jobenomics defines micro-businesses as having 1-19 employees, which includes self-employed individuals.
U.S. Private Sector Employment by Company Size
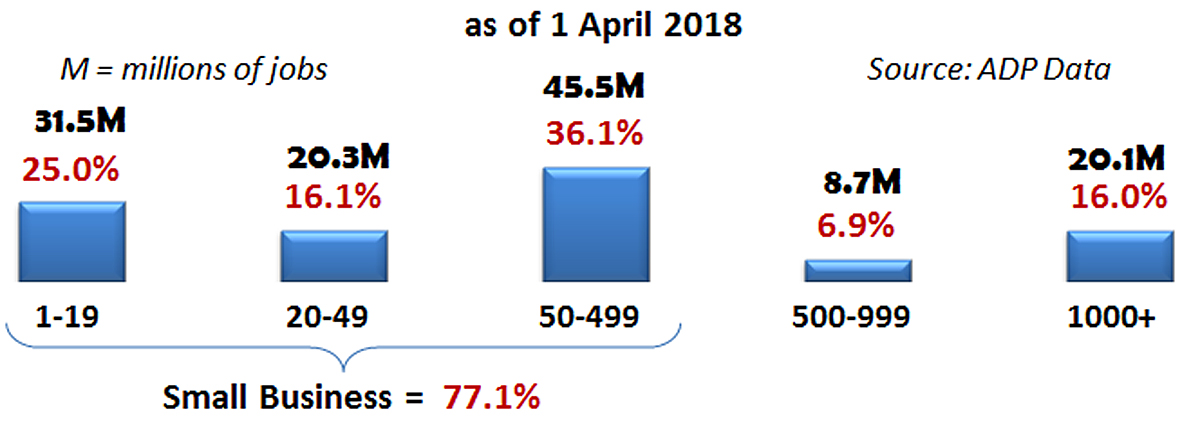
As reported by ADP, small businesses are undeniably the dominant employer in the United States. Small companies with less than 500 employees employ 77.1% of all private sector Americans with a total of 97,166,014 employees—over 3.4-times the number of large enterprises with more than 500 employees that have 28,795,066 employees. Micro-businesses with 1-19 employees employ 1.6-times the number of giant corporations with over 1,000 employees (31,450,943 versus 20,136,146).
U.S. Private Sector Jobs Created This Decade by Company Size

Since the beginning of this decade, small businesses created 73.4% of all new jobs in the United States. Small businesses with less than 500 employees created 2.8-times more jobs as large businesses with 500+ employees, or 13,455,699 versus 4,881,380 new jobs respectively. Micro and self-employed firms with 1-19 employees produced 87% as many jobs as large-scale corporations with over 1,000 employees (3,113,740 versus 3,595,904).
U.S. Private Sector Jobs Created Last Month by Company Size
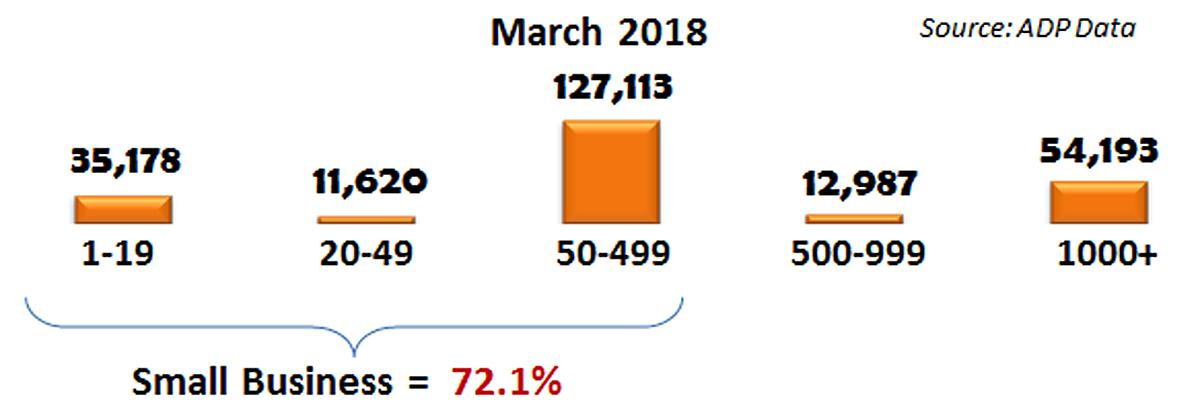
Last month (March 2017), U.S. small business (1-499 employees) created 72.1% of all new jobs. This percentage compares favorably with previous months during the Trump Administration: 68.7% February, 65.4% January 2018, 78.6% December, 82.0% November, 47.1% October, 17.9% September, 35.8% August, 68.5% July, 69.2% June, 76.9% May, 94.0% April, 93.7% March, 75.1% February, and 72.8% January 2017.
As stated since the beginning of this decade, small businesses created around three-quarters of all new jobs in the United States. While impressive, the small business job creation engine is losing power.
U.S. Small Business (1-499) Job Creation Engine Is Faltering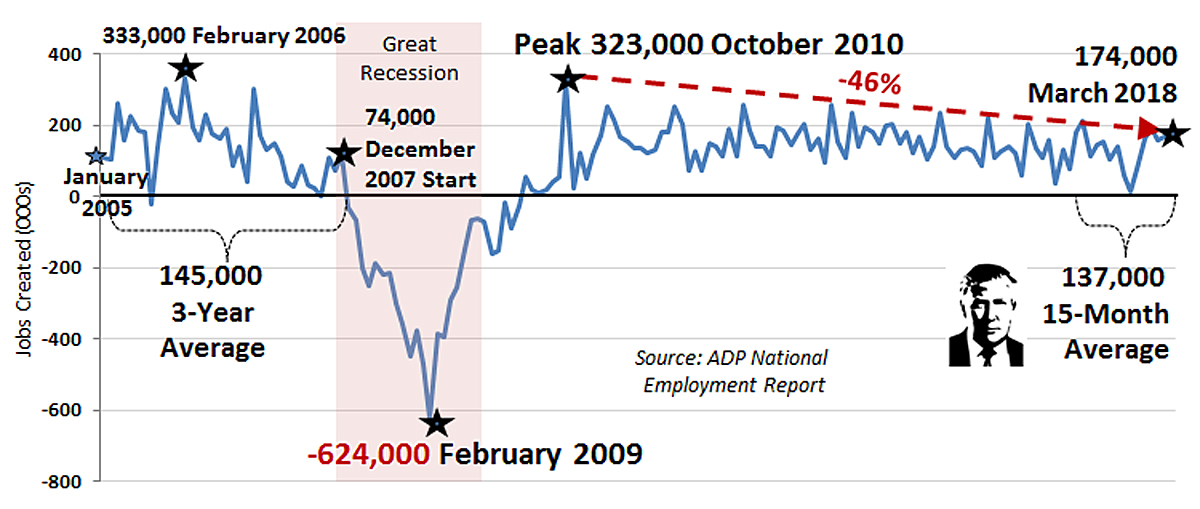
During the depth of the Great Recession in February 2009, small businesses laid off 624,000 people in a single month, which is indicative of the hazards of a stalled small business engine. Twenty months later, the small business engine was hitting on all cylinders and generated a peak of 323,000 jobs in October 2010. Since this post-recession peak to today, small business job creation dropped 46% to 174,000 in March 2018, a difference of 149,000 jobs. Consequently, over a 120-month period, a deficit of 149,000 jobs equates to 18 million fewer jobs per decade. The Trump Administration could use these lost jobs to fulfill the President’s vision of 25 million new jobs over the next decade.
U.S. Micro-Business (1-19) Job Creation Engine Is Also Faltering
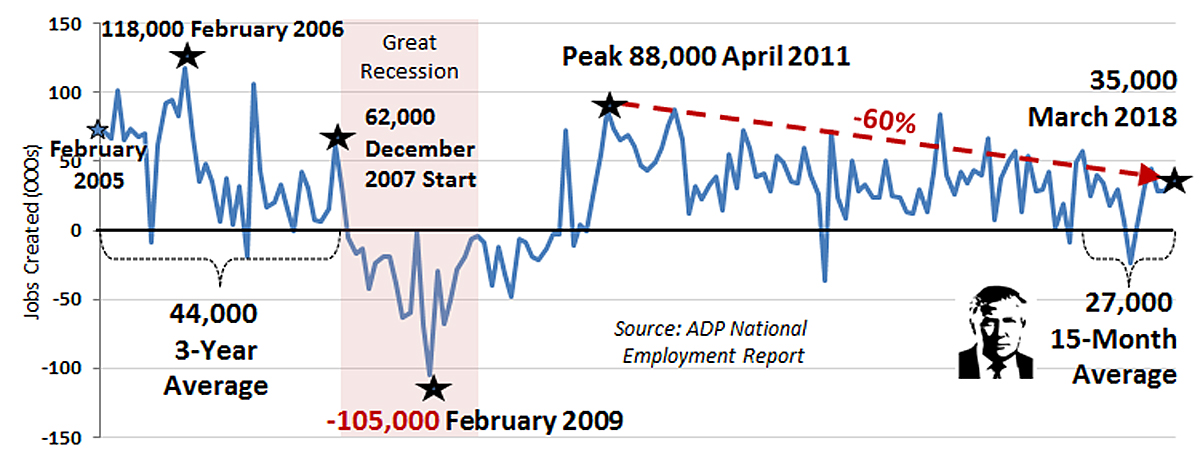
If the small business engine had heart, it would be a micro-business. Most micro-business are self-employed firms (one-person incorporated or unincorporated), family businesses (mom-and-pops) or partnerships. Micro-businesses are also the heart the U.S. economy. Mom-and-pop stores are essential to local communities. They are the type of enterprises that hire the unemployed and give part-time jobs to high schoolers and other entry-level individuals who want to work. Continued deterioration and denigration of micro-businesses can only lead to economic stagnation.
Sadly, the U.S. micro-business heart is suffering from a form of atherosclerosis (narrowing or blockage of the arteries) as indicated by a 60% decline since the post-recession peak. The average micro-business job creation over the rump Administration was 27,000 jobs per month, which is a meager number considering the relative strength of the U.S. economy. The 3-year average prior to the Great Recession was 44,000 new jobs per month.
The vast majority (95%) of small and micro-businesses are “pass-through” businesses (sole proprietorships, partnerships, and S-Corporations that pay taxes based the owner’s income tax returns). Consequently, the recent Tax Cuts and Jobs Act (TCJA)’s pass-through businesses tax reduction from 39.6% to 20% for qualified business income should have a positive economic and labor force impact in 2018. The primary intent of TCJA’s pass-through business legislation was to boost mom-and-pop business growth and employment.
Unfortunately, most of the earnings generated by pass-through entities are not by mom-and-pop businesses but by high net-worth individuals (e.g., hedge fund managers, management consultants, and real estate executives) who self-incorporate as an LLC or S-Corp to reduce their tax burden. While the TCJA includes “anti-abuse measures” to ensure that only owners of “bona fide” businesses claim the 20% rate, abuse is likely to grow now that a new “territorial system” exempts foreign profits by U.S. business. A shrewd Wall Street hedge fund manager or real estate broker can start a pass-through business on a Caribbean island to reduce their tax burden and deduct business expenses while enjoying Mai Tais on the beach.
While the Jobenomics outlook for small and self-employed business is positive throughout 2018, it is less bright than it could be. Washington and corporate America need to place significantly more attention on small business development and sustainment. Tax cuts will help but are not the solution to the problems facing small businesses.
America needs to rejuvenate the small business entrepreneurial spirit and create a worldview that small and micro-businesses are a viable alternative to the decreasing number of high-paying full-time jobs. Women-owned and minority-owned businesses are deserving of far more attention than they receive today. Additionally, digitally-savvy Screenagers (Generation Z) are suited for starting micro-business tailored to meet the needs of the emerging digital economy and contingent labor force. If the 29.6 million American small businesses created or hired only one net new employee over the next several years, Trump’s 25 million new jobs goal could happen in a much shorter timeframe than he currently envisions.
The rate of small business startups is also dropping precipitously. Business startups are the seed corn of the U.S. economy. Without the planting and fertilization of these seedlings, the fields of American commerce will be fallow.
Of the estimated three million startups over the last decade, tens of thousands of ultra-high growth businesses (called unicorns and gazelles) have generated millions of net new jobs for America. According to the Kauffman Foundation, these fleet-footed startups account for 50% of all new jobs created. Uber, Lyft, Airbnb, SpaceX, WeWork, and Pinterest are recent examples of unicorns—a startup company that rapidly achieves a stock market valuation of $1 billion or more. A gazelle is a high-growth company that increases revenues by over 20% per year for four-plus years. The top-10 U.S. gazelles include Natural Health Trends, Paycom Software, Lending Tree, ABIOMED, MiMedx Group, Facebook, NetEase, Ellie Mae, Amazon.com and Arista Networks, according to Fortune magazine.
Regarding new starts (firms less than 1-year old), the Census Bureau’s Business Dynamic Statistics indicate that the United States is now creating startup businesses at historically low rates, down from 16.5% of all firms to 8% in 2014 (latest data). Based on a Wall Street Journal (WSJ) analysis of this Census Bureau data, “If the U.S. were creating new firms at the same rate as in the 1980s…more than 200,000 companies and 1.8 million jobs a year” would have been created.
During the heydays of the 1970s, Bill Gates and Steve Jobs started Microsoft and Apple, two of the world’s most celebrated companies with a market capitalization (the value of the total number of shares multiplied by the present share price) of $741 billion and $911 billion respectively. One has to wonder if these companies would have started in our current austere startup environment?
According to a Census Bureau’s Business Dynamic Statistics press release on 20 September 2017, in 2015, 414,000 U.S. startup firms created 2.5 million new jobs, which is well below the pre-Great Recession average of 524,000 startup firms and 3.3 million new jobs per year for the period 2002-2006. In 2015, job creation minus job destruction equaled net job creation of 3.1 million, which supports the Jobenomics hypothesis that net job creation is a critical statistic for policy-makers than just focusing on only new jobs. Other tidbits of the 2017 Business Dynamic Statistics press release include:
- 5 million U.S. small businesses (1-499 employees) created 45% (1,400,711) of all net new jobs compared to 20 thousand large enterprises (500+ employees) that produced 55% (1,690,591) net new jobs.
- 5 million micro-businesses (1-19 employees) net job creation equated to 14% (434,203) of all net new jobs.
- Net job creation in urban areas was over twice the rate of rural communities, or 2.7% versus 1.2% respectively.
According to another Kauffman Foundation analysis of the Census Bureau’s Business Dynamic Statistics, most city and state government policies that look to big business for job creation are doomed to failure because they are based on unrealistic employment growth models. “It’s not just net job creation that startups dominate. While older firms lose more jobs than they create, those gross flows decline as firm’s age. On average, one-year-old firms create nearly 1,000,000 jobs, while ten-year-old firms generate 300,000. The notion that firms bulk up as they age is, in the aggregate, not supported by data.”
Jobenomics agrees with both the WSJ and Kauffman analyses. Moreover, the Jobenomics 20-part series, entitled President Trump’s New Economy Challenge provides a detailed analysis why the Trump Administration’s bold economic (4% GDP) and job creation (25 million new jobs) vision is likely to fall short due to its concentration on big business rather than small business creation and sustainment. Small business is not only critical to net job creation; it is the primary determinant for GDP growth given the fact that big firms are increasingly looking at automation and outsourcing (to foreign workers or domestic contingency workers) to replace the conventional full-time labor force.
Jobenomics Gross Domestic Product (GDP) Analysis.
The ideal rate for U.S. GDP growth is around 3%. Any GDP growth below 2% is sclerotic, which makes the U.S. economy vulnerable to financial downturns.
Real GDP Quarterly Percent Change This Decade
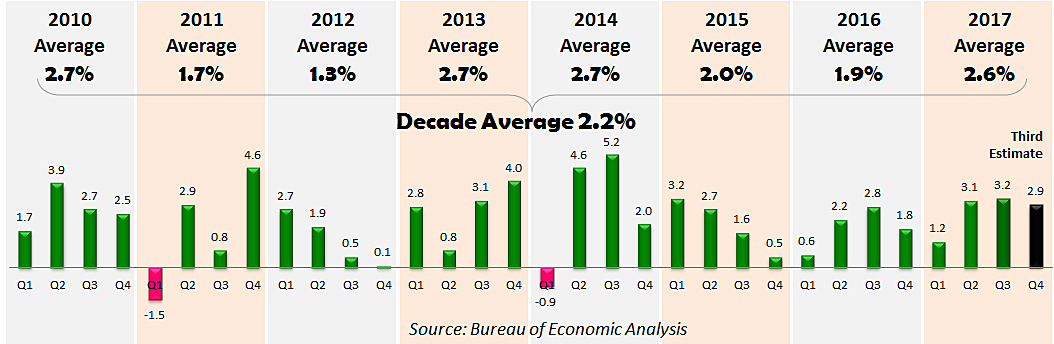
According to the U.S. Bureau of Economic Analysis (BEA), during the post-recession recovery period from 2010 through 2017, U.S. GDP averaged 2.2%. In 2015 and 2016, U.S. GDP grew by subpar rates of 2.0% and 1.9% respectively. During the 8-years of the Obama Administration, GDP averaged 1.8%. During the first year of the Trump Administration, GDP averaged 2.6%. While the second and third quarters posted over 3.0% gains, Q4 2017 (October, November and December 2017) was 2.9% according to the BEA’s Third Estimate. The final Q4 2017 GDP Report and Q1 2018 Advance Estimate is due on 27 April 2018.
For Q1 2018, the Federal Reserve Bank of Atlanta’s GDPNow forecast is 2.3% as of 5 April 2018, which is down from a high of 5.4% on 1 February 2018. The GDP Now’s “Blue Chip consensus” survey of leading business economists forecast that Q1 2018 growth will be 2.2% with a low estimate of 1.8% and a high estimate of 2.6%.
While GDP growth does not ensure employment growth, sclerotic GDP growth discourages business hiring, consumer spending and labor force expansion. Sclerotic GDP growth also discourages lower rates of unemployment and voluntary workforce departures. Negative GDP growth creates recessions and depressions depending on the severity and longevity of the contracting economy.
The period of sclerotic GDP growth from 2000, has dramatically impacted the American middle-class and the U.S. labor force that is weaker by 11 million workers today than at the beginning of the 21st Century. Even though wages have improved in the last year, for most American workers, real salaries (purchasing power) have not increased significantly for decades. America’s aggregate household income has shifted from middle-income to upper-income households, causing many middle-class workers to leave the workforce altogether. The solution to building a robust middle-class is to accelerate GDP growth, which requires the creation of more productive private sector jobs, which, in turn, can only be generated by a massive expansion of the small business sector.
Concluding Thoughts.
President Trump’s vision of a “dynamic and booming economy” is one that can produce a GDP growth rate of “4% over the next decade.” This vision ultimately depends on mass-producing business, especially small business, in sufficient quantities to create 25 million net new jobs. Sclerotic (0% to 2%) or recessive (negative) GDP rates depreciate a government’s legitimacy. Robust GDP growth of over 3% will have the opposite effect.
According to the nonpartisan Congressional Budget Office’s 2017 to 2027 Budget and Economic Outlook report, “over the next five years, the monthly increase in nonfarm payroll employment, which is estimated to average 160,000 jobs in the first half of 2017, is projected to settle down to an average of 64,000 jobs.” If this CBO forecast is correct, the next decade is likely to produce only 9 million American jobs, which is far short of President Trump’s projection of 25 million new jobs. Note: last year’s BLS Employment Projections: 2014-24 Summary report forecasts that the United States will produce only 9.9 million new jobs over the next decade.
Jobenomics tends to agree with these rather gloomy CBO and BLS forecasts for the reasons discussed in the Jobenomics 20-part series entitled President Trumps New Economy Challenge. However, the Trump Plan can be amended to change CBO and BLS labor force projections from negative to positive.
With proper leadership, the Administration can lift tens of millions of Americans out of poverty by making the following four structural changes to President Trump’s economic and job creation plan:
- Balancing the traditional standard industrial economy with the newly emerging nonstandard digital economy,
- Mitigating the mass-exodus of capable workers who are voluntarily departing the U.S. labor force for lives of dependency and alternative (often illicit) lifestyles,
- Addressing the challenge of the ever-growing contingency workforce that will soon be the dominant form of labor in the United States, and
- Mass-producing small and self-employed businesses—the engine of the U.S. economy—and the employer of the vast majority of Americans.
If the Trump Administration can achieve 4% GDP growth in a stable global economy, the U.S. economy will boom, and Americans will be euphoric. This feat will not be easy. The last time that the United States reached 4% in a single year was 2001. The last time that the United States achieved 4% in ten consecutive years over the previous 5-decades was never (3.5% was the highest from 1976 to 1985). Notwithstanding, if the Trump Administration can tie the 3.5% record over the next decade, they will be vindicated and worthy of much praise.
About Jobenomics: Jobenomics deals with the economics of business and job creation. The non-partisan Jobenomics National Grassroots Movement’s goal is to facilitate an environment that will create 20 million net new middle-class U.S. jobs within a decade. The Movement has a following of an estimated 20 million people. The Jobenomics website contains numerous books and material on how to mass-produce small business and jobs as well as valuable content on economic and industry trends. For more information see https://jobenomics.com/.

