

President Trump’s New Economy Challenge (Part 14 of 20). One might think that the U.S. Department of Labor (DoL) main purpose would be a forward-looking organization that positions the U.S. labor force for major disruptive trends like the emerging digital economy, the contingent workforce and the massive exodus of able-bodied workers. Unfortunately, the opposite seems to be the case. By its own admission, the DoL “fosters and promotes the welfare” of the America’s 140 million workers and enforces several hundred federal laws and many thousands of federal regulations that cover the complete gambit of workforce activities for over ten million beleaguered American employers. No wonder why, President Trump’s top two picks for Labor Secretary were both lawyers who will be in charge of a hodgepodge organizational chart of 30 bureaus, offices, agencies, administrations and other special interest labor force groups. Trump’s first pick was Andrew “Andy” Puzder, a lawyer and fast-food CEO, who suddenly withdrew his nomination. Trump’s second pick was Alexander Acosta, a cum laude Harvard Law School graduate, U.S. Court of Appeals law clerk, a Washington D.C. lawyer, an employment and civil rights law professor (George Mason University School of Law), a former collective bargaining and unfair labor practices official (National Labor Relations Board), a civil rights attorney (Assistant Attorney General for the Department of Justice Civil Rights Division), and a college law school dean (Florida International University). From a Jobenomics perspective, the Trump Administration is going to need much more than a great lawyer to restore a U.S. labor force that is in a serious state of decline.
Current U.S. Employment, Job Gains and Job Losses
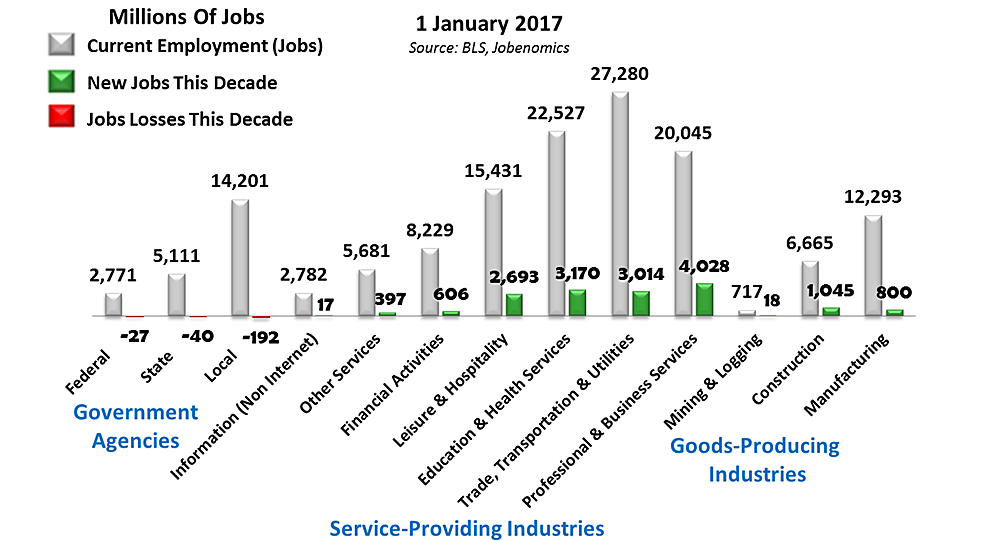
This chart is a snapshot the current state of the U.S. labor force in terms of current jobs in gray, new jobs in green and job losses in red. In general terms, the U.S. labor force is in a much better position today than it was in during the Great Recession. Seven private sector service-providing industries employ 71.2% of all U.S. workers (103,425,000) jobs, followed by federal, state and local governments that employ 15.3% of the workforce (22,223,000) jobs and by the three private sector goods-producing industries that employ 13.5% of the workforce (19,655,000). Job gains occurred in all 10 private sector industries this decade. Job losses occurred at all three levels of government (federal, state and local) this decade. However, this is history.
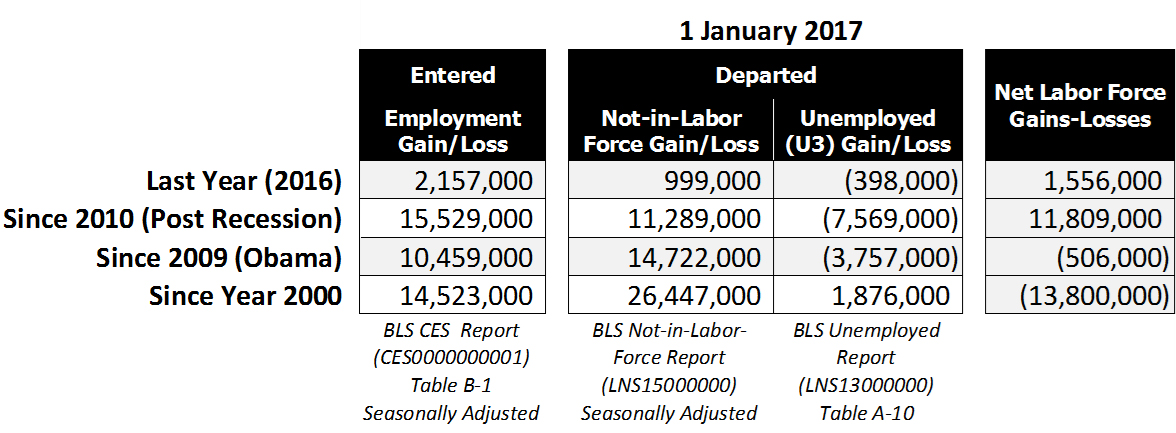
Labor Force Gains and Losses
Positive Labor Force Trends. Employment and economic data were positive over the last quarter. Three areas are noteworthy: net labor force gains and losses, private sector service-providing industry growth, and continued small business strength.
- Labor Force Gains and Losses. During 2016, 2,157,000 citizens entered the labor force, 999,000 more citizens were enrolled in the Not-in-Labor-Force (abled-bodied adults that chose not to work), and 398,000 citizens were released from the ranks of the officially unemployed, for a net gain of 1,556,000. Net labor force gains-losses are also shown since 2010 (Post Recession period), since 2009 (Obama era) and since the turn of the Century in 2000. While the United States has posted slow but steady gains during the post-recession era, the U.S. labor force is still 13,800,000 weaker today in terms of gainfully employed workers. It is also important to note that this net loss does not include population growth of 42 million additional Americans today compared to 2000 (282 million versus 324 million).
- Service-Providing Industry Growth. Private sector service-providing industry employment continues to grow now employing 103 million Americans. 20 million are employed by private sector goods-producing industries and 22 million are employed by government (federal, state and local, not including the Armed Forces and institutionalized citizens. 2% of all new jobs this decade were created by the seven industries in the service-providing sector. 81.7% of all new jobs were produced by the four leading service-providing industries (Professional & Business Services; Education & Health Services; Trade, Transportation & Utilities; Leisure & Hospitality). Manufacturing and Construction contributed 5.1% and 6.7%, respectively.
- Small Business Strength. Small business is the engine of the U.S. economy—a fact that is generally underappreciated by American policy-makers and the public. 78.2% of all Americans are now employed by small businesses that created 73.8% of all new jobs this decade. During calendar year 2016, small business (<500 employees as defined by the Small Business Association) created 2.1-times as many jobs as large businesses (500+ employees). During calendar year 2016, micro business (<20 employees) created 70% as many jobs as very large corporations (1000+ employees).
Negative Labor Force Trends. Positive labor force trends are offset by six negative trends that threaten economic growth and stability. These trends include voluntary workforce departures, contingent workforce expansion, sclerotic GDP growth, population/workforce imbalance, low wages/income and declining business startups.
- Small Business and Startup Business Decay. Small business is the engine of the U.S. economy. However, the rate of small business job creation is dropping precipitously. During the seven-year post-recession period between 2010 and 2017, small businesses created 2.9-times as many jobs as large businesses. During the last decade (2007 to 2017, inclusive of the Great Recession), small businesses created 6.7-times as many jobs as large businesses that downsized to a much greater extent during the recession. Micro business has followed the same path. During the seven-year post-recession period between 2010 and 2017, micro businesses created 90% as many jobs as very large corporations. During the last decade, small businesses created 300% as many jobs as very large corporations during and after the recession.
In terms of new starts (firms less than 1-year old), the BLS reports that the United States is now creating startup businesses at historically low rates, down from 16.5% of all firms to 8% in 2014 (latest available data on new starts). Based on a Wall Street Journal (WSJ) analysis of this recently released BLS report’s data, “If the U.S. were creating new firms at the same rate as in the 1980s that would be the equivalent of more than 200,000 companies and 1.8 million jobs a year.” The WSJ also reports that share of employment at firms less than 1-year old has slipped from nearly 4% to about 2% of private-sector jobs from the 1980s to today. Business startups are the seed corn of the U.S. economy. Without the planting and fertilization of these seedlings the fields of American commerce would remain fallow.
- Voluntary Workforce Departures. Since year 2000 through 2017, 26,447,000 adult workers voluntarily departed the U.S. labor force. Able-bodied (capable of working) adults who have no job and are no longer looking for a job are accounted by the BLS in the Not-in-Labor-Force category. From 2000 to 2017, the Not-in-Labor-Force cadre grew from 68,655,000 to 95,102,000, an increase of almost 26.5 million citizens who more often than not are dependent on public/familial assistance. Today, citizens in the Not-in-Labor-Force exceed those enrolled in the Total Unemployed (U6) category by 6-times and 12-times the number in “Officially” Unemployment (U3) category. This great disparity is rarely addressed by policy-makers, analyzed by decision-makers or mentioned by the media’s talking-heads, all of whom focus almost entirely on the Official U3 Unemployment Rate that is now at a near post-recession low of 4.7%.
- Contingent Workforce Expansion. Contingent workers are defined by the U.S. government as “nonstandard” workers who work part-time by necessity (temporary and day workers) or by choice (freelancers, independent contractors and the self-employed). Today, the contingent workforce is approximately 61,000,000 employed Americans or 40% of the total employed workforce. By 2030, this number will grow to 80,000,000 or 50% of the U.S. employed workforce—a trend that is largely unknown to U.S. policy-makers and the American public.
- Sclerotic GDP Growth. Most economists believe that economic growth depends on employment and GDP growth. The ideal rate for U.S. GDP growth is 2% to 3%. Any GDP growth below 2% is considered sclerotic growth that makes the U.S. economy vulnerable to financial downturns. According to the Bureau of Economic Analysis (BEA), during the post-recession recovery period from Q1 2010 through Q3 2016, U.S. GDP averaged 2.1%. In Q1 and Q2 2016, U.S. GDP grew by an abysmal 0.8% and 1.4%. In Q3 2016, GDP increased significantly by 3.5%. BEA “advanced” estimates for Q4 2016 and for the entire 2016 calendar year are 1.9% and 1.6% respectively. Advanced estimates are based on “source data that are incomplete or subject to further revision. Notwithstanding any future upward revisions, 2016 was a year of continued sclerotic growth. Federal Reserve economists forecast Q1 2017 growth of 2.3%. President Trump’s economic vision includes doubling U.S. GDP growth to the 3.5% to 4.0% range according to his economic plan. He has also selected capable business and financial executives for his cabinet to make this vision a reality—this reality ultimately depends on business, especially small business—growth in order to generate goods and services necessary to grow GDP.
- Population/Workforce Imbalance. As of 1 January 2017, out of a U.S. population of 325 million, 120 million private sector workers support 32 million government workers and contractors, 95 million able-bodied people who can work but chose not to work, 63 million who cannot work, and 15 million unemployed and underemployed. The U.S. economy is not sustainable with only 37% supporting an overhead of 63%. The growing contingent labor force, which consists of mostly lower paid wage earners, makes the overhead burden even more precarious. More people earning livable wages and having greater discretionary income must be productively engaged in the labor force for the U.S. economy to flourish.
- Low Wages/Income. According to the latest U.S. Census Bureau’s 2015 Annual Social and Economic Supplement to the Current Population Survey, the U.S. average (median) income for a worker with a full-time job was $57,582. Out of a total of 163 million American workers 15-years old and over with earnings, 73% (119 million) earned below mean income of $57,582 for full-time workers. If the 159 million adult citizens with no reported earnings (94 million that can work but choose not to, and the 65 million who cannot work) were included, an astounding 86% (278 million) were below average. This imbalance is much larger than most people perceive and is a major contributor to the social unrest being exhibited today and a major issue for the Trump Administration.
Secretary Acosta’s Labor Force Challenge. In regard to the decaying U.S. labor force, Jobenomics contends that the proper way to gauge the strength of the U.S. labor force (and the overall economy) is by evaluating employment rather than unemployment. The reason for this statement is relatively straightforward: working people provide the goods and services that grow the economy. The more people that America puts to work, the stronger the economy gets. As discussed in the “Why Work Anymore?” posting, the American people will figure out that the current way our government calculates unemployment is seriously flawed. The use of whimsical survey questions, like “do you currently want a job”, makes unemployment a poor barometer of U.S. labor force strength.
When evaluating U.S. labor force metrics, one should measure the workforce in relation to the entire population as opposed to current Department of Labor denominators like the Civilian Noninstitutional Population (which few citizens understand) or the Civilian Labor Force (which includes only working people or people looking for work, but does not include adults capable of working but choose not to work).
This chart, developed by Jobenomics using the latest U.S. Census Bureau and Department of Labor’s Bureau of Labor Statistics data, shows a number of topline employment metrics in relation to the U.S. population from 1 January 1980 to 1 January 2017.
Decaying U.S. Labor Force
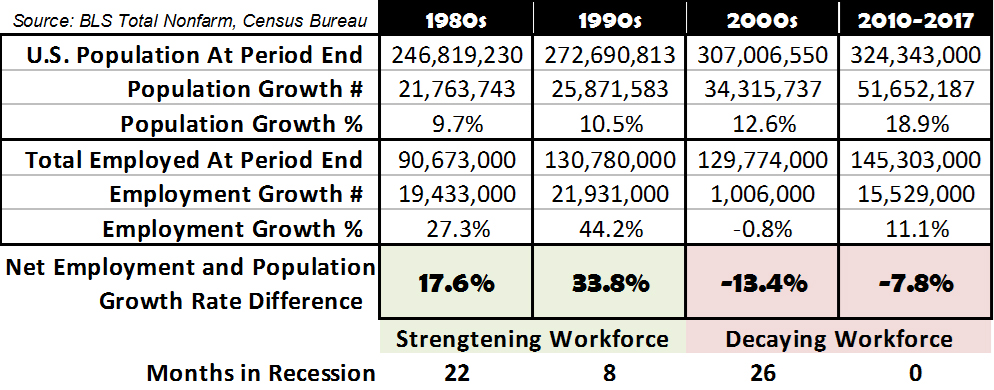
The 1980s and 1990s were decades of robust job creation and a strengthening workforce. In the two decades prior to the turn of the 21st Century, employment growth increased significantly faster than population growth (1980-1989: Employment Growth Rate was 27.3% versus a Population Growth Rate of 9.7%, and 1990-1999: Employment Growth Rate 44.2% versus Population Growth Rate 10.5%). As a result, the 1980s and 1990s produced an average of about 20 million net new jobs in a population that was 52 to 78 million people smaller than today. Equally important is the fact that these jobs were produced during two decades that suffered 30 months of recession.
The 17-year period from year 2000 to today can be characterized as an era of weak job creation and a decaying workforce. During this era, employment growth decreased significantly faster than population growth (2000-2009: Employment Growth Rate was -0.8% versus a Population Growth Rate of 12.6%, and 2010-2017: Employment Growth Rate 11.1% versus Population Growth Rate 18.9%). The 1980s was a particularly bad decade with negative employment growth due to 26-months in two recessions, the second of which was the 18-month long Great Recession of 2007-2009 that precipitated a global financial crisis. The most recent seven year period were years of sclerotic job creation despite the fact the U.S. posted the longest streak of continuous job growth on record.
However Secretary Acosta’s Bureau of Labor Statistics may not be as confident as their new boss’ President regarding America’s ability to generate the amount of jobs needed to fulfill the Trump Administration vision. Robust labor force growth is not currently forecast by BLS employment projections.
Last year’s BLS Employment Projections: 2014-24 Summary report forecasts that the United States will produce only 9.9 million new jobs over the next decade, which is a shortfall of 10.1 million net new jobs needed to accommodate new workforce entrants and maintain full employment. 9.9 million jobs is inconsistent with the new Administration’s 25 million new job goal, especially in the area of manufacturing and the two other goods-producing industries (construction and mining) which were highly promoted during the Trump campaign. The BLS report projects meager gains of 56,500 jobs in goods-producing industries, 9,263,600 jobs in services-providing industries, 26,900 jobs in agriculture/forestry/fishing industries and 579,300 jobs in the non-agricultural self-employed workforce over the next decade.
Stay tuned for the next installment in the President Trump’s New Economy Challenge series entitled, “President Trump’s Income Inequality Challenge” scheduled for release on 23 March 2017.
Click to read the rest of the articles in a 20-part series on President Trump’s New Economy Challenge. Note: many series articles require a small ($5) subscription fee. Non-series articles and Jobenomics project reports are free at Jobenomics.com. All subscription fees are directly (100%) applied to the Jobenomics Urban Renewal Programs. Donations to revitalizing blighted inner-cities are most welcome.
About Jobenomics: Jobenomics deals with economics of business and job creation. The non-partisan Jobenomics National Grassroots Movement’s goal is to facilitate an environment that will create 20 million net new middle-class U.S. jobs within a decade. The Movement has a following of an estimated 20 million people. The Jobenomics website contains numerous books and material on how to mass-produce small business and jobs. Monthly website traffic exceeds one-half million hits, which is indicative of the high level of public interest regarding economic, business, labor force and workfare solutions. For more information, see Jobenomics Overview and the Author’s Biography.

