

In today’s highly-charged political environment, what people want to know is how today’s president is performing compared to past presidents. Of the twelve presidents since WWII, President Trump’s average 201,083 monthly job creation rate places him in third-place following President’s Clinton and Carter. However, U.S. job creation is now gaining sufficient momentum to achieve President Trump’s 25 million new jobs objective over the next decade. In the 24-months since President Trump took office, the Administration averaged 201,083 new jobs per month, which is twice the monthly amount of the Obama Administration (110,365) and over 9-times the amount of Bush II Administration (22,031).
What will transpire is 2019 is anyone’s guess. On the plus side, pro-business policies have taken root and are producing good results. On the negative side, the political divide in Washington is stalling growth. The recent partial government shutdown must not be a 2019 harbinger of things to come. Download, at no cost, this posting, other Year Ahead postings and Jobenomics economic, community, business, and workforce development documents in the Jobenomics Library.
Average Monthly Job Creation Rate by President since WWII
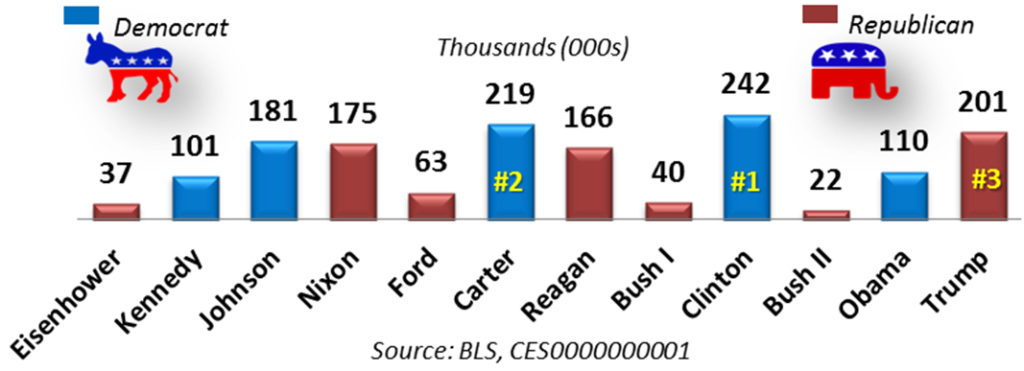
In today’s highly-charged political environment, what people want to know is how today’s president is performing compared to past presidents. As color-coded by political party, of the twelve presidents since WWII, President Trump’s average 201,083 monthly job creation rate places him in third-place following President’s Clinton (242,010) and Carter(218,646). However, adjusting for population size (e.g., U.S. population during the Eisenhower Administration was almost half, 160 million, of today’s population of 329 million), President Trump would rank sixth following Carter, Clinton, Johnson, Nixon, and Reagan.
To some extent, comparing President Trump with President Eisenhower is an apples-to-oranges analogy. The American economy, workforce, industry and technological state of affairs were markedly different in the 20th Century when compared with the 21st Century. The following chart shows the job creation rate by year for America’s 21st Century presidents (Bush, Obama, and Trump) as reported by the U.S. Bureau of Labor Statistics (BLS) from data obtained by the U.S. Census Bureau’s Current Population Survey (CPS) of U.S. households.
Job Creation Scoreboard since 2001 by Year
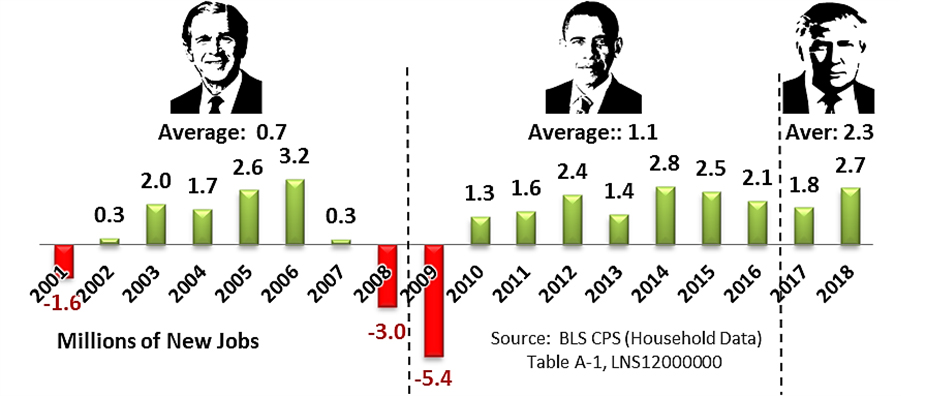
As of 1 January 2019, the Trump Administration’s job creation rate averaged 2.3 million per year (2.7 million in 2018) compared to the Obama Administration’s average of 1.1 million per year (2.0 million per year during the post Great Recession period from 2010 through 2016) and the Bush Administration’s average of only 690,000 per year.
The most highly-anticipated and widely-reported U.S. government statistic is the job creation number in the monthly BLS Employment Situation Summary news release.[1] This single statistic not only drives policy-making but it is overly used by decision-makers and media-pundits to judge the health of the U.S. economy and the efficacy of the Executive Office of the federal government. The following chart shows the historical monthly job creation rate by month that the BLS obtains from the Census Bureau’s Current Establishment Statistics (CES) survey of nonfarm business establishments.[2]
Job Creation Scoreboard since 2001 by Month
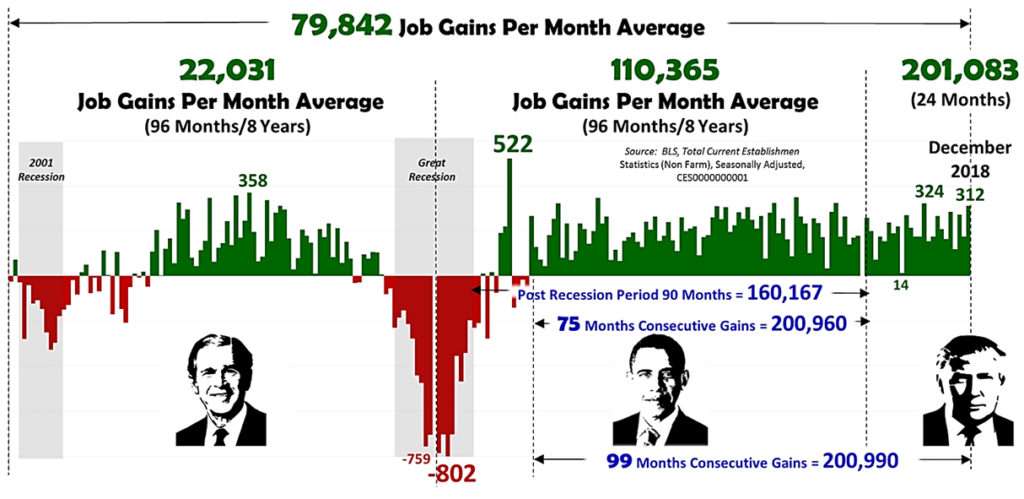 From 1 January 2001 to 1 January 2019, the United States averaged an abysmal 79,842 new jobs per month. During these 19 years, the monthly job creation high water mark was 522,000 new jobs in May 2010, and the low water mark for job losses was 802,000 in March 2009 during the depth of the Great Recession. Both of these high and low water marks occurred during the Obama era. President Bush’s high water mark was 358,000 new jobs in April 2005, and his low water mark was 759,000 job losses in November 2008. President Trump’s highest job creation month was 324,000 in February 2018 and has not experienced any monthly job losses during his tenure (Trump’s lowest monthly figure was 14,000 new jobs in September 2017). President Trump’s lowest monthly job creation month was in September 2017 with only 14,000 new jobs created.
From an Administration standpoint,
- The Bush Administration (2001 through 2008) created an average of only 22,031 new jobs per month, due to the onslaught of two major recessions, the calamity of 9/11 and the United States’ expensive mobilization for the global war on terrorism, and numerous natural disasters.
- The Obama Administration (2009 through 2016) created an average 110,365 job gains per month. Subtracting the six months of the Great Recession that Obama “inherited” from the previous administration, the average job creation rate during the 90-month post-recession period yielded an average of 160,167 new jobs per month. Perhaps, the most important legacy of the Obama Administration is 75-months of consecutive job gains averaging 200,960 jobs per month.
- The Trump Administration (2017 and 2018) averaged 201,083 new jobs per month. Equally impressive, the Trump Administration continued the job creation streak with 24 consecutive months of job gains and extended the continuous job creation run to 99-months—the longest span of labor force gains since the Bureau of Labor Statistics began record keeping in February 1939.
To fulfill President Trump’s campaign promise of 25 million new jobs over the next decade, the Administration needs to generate 210,146 jobs per month in the remaining 96-months of this decade-long goal. If the United States can maintain the job creation momentum achieved by the Trump Administration in 2018 (average of 219,833 new jobs per month), the next decade could produce more new jobs than any decade since the 1950s. 2019 will be a pivotal year to see if the Administration can maintain its momentum. Given 2019’s rough start, robust job generation is facing intense political headwinds in the run-up to the 2020 Presidential elections.
While this presidential comparison is interesting, it is an unproductive way of interpreting the Job Creation Scoreboard statistics. By comparing the current president to past presidents, decision-making is conducted by looking backward, or in naval parlance, by steering a ship by looking at its wake. From a Jobenomics perspective, a better way to navigate forward is to establish the number of jobs needed to fulfill labor force requirements. To do so, the U.S. must create a reasonable job creation standard.
Most economists believe a reasonable U.S. standard is 250,000 new jobs per month. While this may seem like a substantial number, it is less than 1/10th of 1% per month (0.076%) of the population of the United States (329,096,000). In actuality, 250,000 is a conservative figure. According to the BLS, in 2006 the U.S. labor force required 243,000 net new workers (the difference between entrants and leavers) per month, in 2016 the number increased to 269,000, and by 2027 the number will increase to a projected 287,000 net new workers.[3]
No standard should not be locked in concrete. Labor force requirements and economic conditions often change drastically quickly. 2019 is likely to be a very turbulent year given the amount of technological, financial and social disruption that is happening globally.
250,000+ Monthly Employment Gains Since 2001
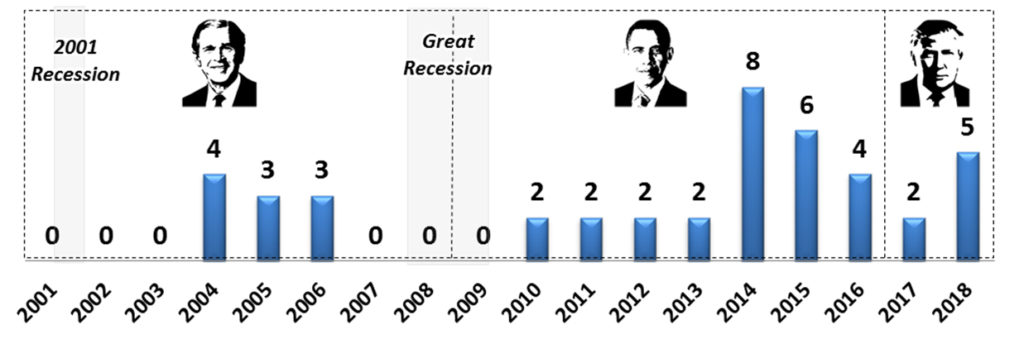
This chart measures the last three presidents against a 250,000 job standard. To put this chart into perspective, one must consider major events in first 19-years of the 21st Century (most notably 9/11 and its aftermath), the effect of two recessions (8 months in 2001 and 18 months 2007-09), and the post-Great Recession recovery period. From 1 January 2000 to 1 January 2019, the United States exceeded the 250,000 job standard 40-times or 20% of the time. During the post-Great Recession’s 99-month run of consecutive of job creation gains, the 250,000 job threshold was exceeded 32-times or 32% of the time.
- The Bush Administration had ten months that exceeded the 250,000 job threshold for an average during his 8-year tenure or only 10% of the time. In defense of this low percentage, President Bush endured a perfect storm of labor force calamities:
- 8-months of the 2001 Recession (March 2001 through November 2001),
- 13-months of Great Recession (December 2007 through December 2008),
- the aftermath of the 9/11 attacks and the ensuing global war on terrorism, and
- nine major Hurricanes (Katrina, Ike, Rita, Wilma, Ivan, Charley, Frances, Jeanne, and Allison) that collectively caused over $275 billion in damage.
- The Obama Administration had 26 months that exceeded the 250,000 job threshold for an average during his 8-year tenure 27% of the time. Almost one-third of President Obama’s performance was due to a recording setting year in 2014 that exceeded the 250,000 threshold 8-times. On the other hand, the Obama Administration had rough start due to the Great Recession that was not over until the middle of the first year of President Obama’s tenure.
- The Trump Administration had seven months that exceeded the 250,000 job threshold for an average during his 2-year tenure 29% of the time. While the Trump Administration started slow with two standard-breaking months in 2017, President Trump delivered five standard-breaking months in 2018.
Barring an economic downturn, successful resolution of the trade disputes and cooperation of the Democrat-lead House of Representatives, the Trump Administration’s upward mega-month trend is likely to continue in 2019 as a result of positive GDP growth (3.3% average in 2018 compared to a decade quarterly average of 2.4% and 1.9% in the year prior to the start of the Trump Administration). Tax cuts and regulatory reforms should also motivate more job creation as American industry gains momentum in a more stable and business-friendly environment. On the other hand, 1 January 2019 marked the start of the Democrat-controlled House of Representatives that has a very different set of priorities than the Administration.
To sum up, 2019 could be a record year for President Trump’s job creation prowess. All the essential ingredients (tax reform, reduced regulation, new trade, and tariff agreements, etc.) are in place. However, America’s political and social divide could upend the upward job creation trend. The recent partial government shutdown debacle is a harbinger for continued political disruption that not only threatens government workers but the private sector workforce as well.
About Jobenomics. Jobenomics concentrates on the economics of business and job creation. The non-partisan Jobenomics National Grassroots Movement’s goal is to facilitate an environment that will create 20 million net new middle-class U.S. jobs within a decade. The Movement has reached an estimated audience of 30 million people. The Jobenomics website contains numerous books and material on how to mass-produce small business and jobs as well as valuable content on economic and industry trends. For more information see Jobenomics.com.
[1] U.S. Bureau of Labor Statistics, Employment Situation Summary, https://www.bls.gov/news.release/empsit.nr0.htm
[2] The BLS has two monthly surveys that measure employment levels and trends: the Current Population Survey (CPS), also known as the Household survey, and the Current Employment Statistics (CES) survey, known as the Payroll or Establishment survey. CPS and CES estimates have distinct employment definitions and methods. Generally speaking, the CES estimates approximately 7 million fewer employees than the CPS since CES data excludes agricultural jobs, the unincorporated self-employed, unpaid family and private household workers and workers absent without pay.
[3] U.S. Bureau of Labor Statistics, Table 3.5 Civilian labor force, entrants and leavers, 2006, 2016, and projected 2026 (Numbers in thousands), https://www.bls.gov/emp/tables/civilian-labor-force-entrants-leavers.htm

