
President Trump’s New Economy Challenge (Part 15 of 20). One of the significant challenges to President Trump, Labor Secretary Acosta and other members of the Trump Administration is dealing with the thorny issue of growing income inequality. The influx of $17 trillion of federal stimuli and trillions of dollars’ worth foreign investment into the U.S. economy since the Great Recession has benefited the rich and decimated the middle class to a greater extent than most people realize. The United States now has reached a point where only 14% (45 million) of Americans earn above average (mean) wages and 86% (274 million) of Americans report earnings below average or no wage at all. No wonder why people are upset about income inequality. The surest way to rectify wage and income disparities is to create income opportunities for willing souls who seek greater self-sufficiency and financial independence.
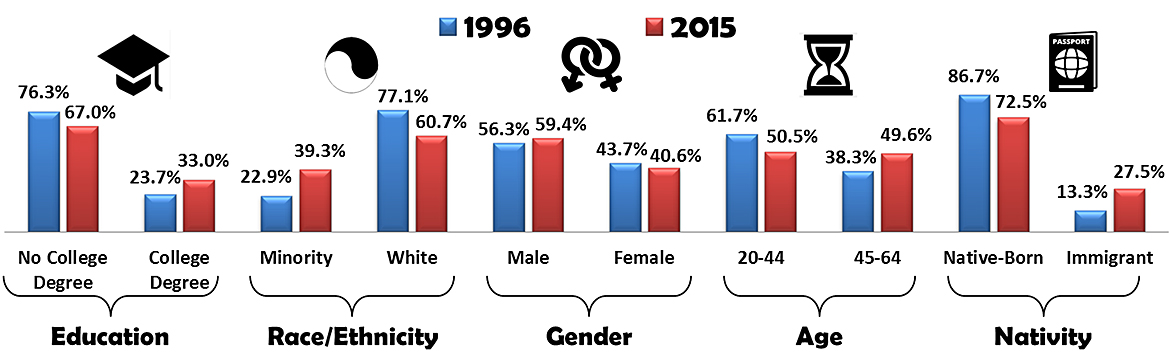
Median Income by Type Citizen
Source: U.S. Census Bureau Income and Poverty in the United States: 2015
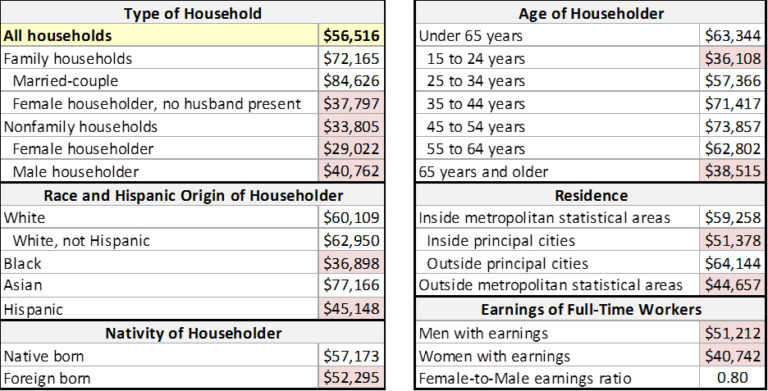
This chart, compiled from the latest U.S. Census Bureau Income and Poverty in the United States report, is a snapshot of income and earnings. In 2015, the medium (average) household income was $56,516, which was up 5% over the previous year after many years of no growth. Even with this increase, most Americans rightly lack confidence about their ability to adequately provide for their family’s fiscal needs. From a policy perspective, the way to build national confidence and restore the “American dream” is to provide meaningful income opportunities with emphasis on those most in need as highlighted in red on the chart.
Income inequality is defined as unequal distribution of household or individual income across the various participants (regional, social, racial, gender) in an economy. Income inequality slows economic growth, reduces social mobility, causes financial conflicts and creates discord. A survey for the World Economic Forum identified growing income inequality as the world’s number one most pressing issue followed by persistent jobless growth as number two and the lack of leadership as number three. After a period of wane, income inequality is growing again in America. U.S. income inequality is often associated with income fairness and is now a dominant issue for policy-makers, media and social activists.
U.S. Household Income by Quintile (20%)

Even with the ups and downs over the last four decades, the United States has generated upward household income growth for all Americans as shown above. Household income is generally used as the standard measure of income wealth by U.S. government agencies. U.S. household income includes the income of the householder and all other individuals 15 years old and over in the household. Household income is defined as income received on a regular basis not including capital gains or non-cash benefits (food stamps, health benefits, subsidized housing, and most other forms of welfare or entitlement benefits). “Median” household income divides the total number of households and families (including those with no income) into two equal parts.
The rich have grown substantially richer than the poor in terms of household “income inequality.” If non-income sources, such as investments and assets, are included, disparity would be much greater in terms of “wealth inequality.” Today, the top 1% of Americans has more wealth than the bottom 95%. The 400 billionaires on the Forbes 400 list are estimated to have more wealth than the bottom 150 million Americans. The Trump Administration is no stranger to this list including: President Trump ($3.7 billion net worth), Deputy Commerce Secretary Todd Ricketts ($5.3 billion) Education Secretary Betsy DeVos ($5.1 billion), Commerce Secretary Wilbur Ross ($2.9 billion) and SBA Administrator Linda McMahon ($1.6 billion). As reported by the Boston Globe, NBC News and CBS News the combined net worth all Cabinet-ranked positions are as high as $14 billion, which is roughly equal to the net worth of approximately 40 million American households. The good news about these individuals, as discussed in previous blogs, is that most of these citizens have been deeply involved with philanthropic institutions, and have committed themselves in their newly appointed positions to use their wealth building skills to benefit all Americans.
86% of All U.S. Wage Earners below Average Income
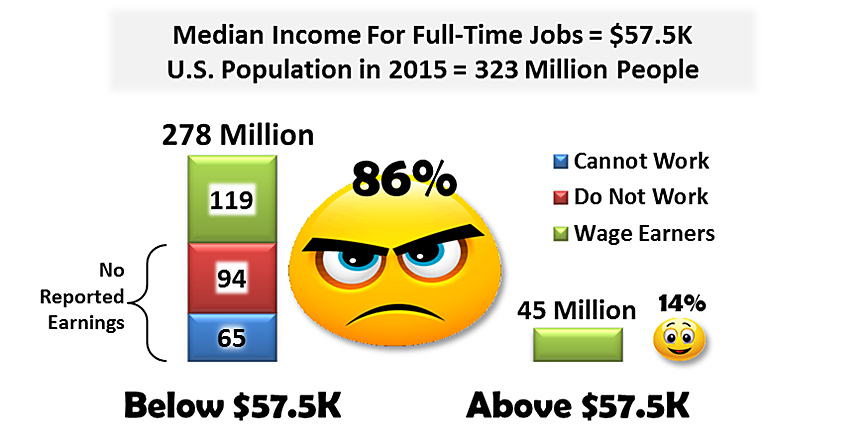
According to the latest U.S. Census Bureau’s 2015 Annual Social and Economic Supplement to the Current Population Survey, the U.S. average (median) income for a worker with a full-time job was $57,582. Out of a total of 163 million American workers 15-years old and over with earnings, 73% (119 million) earned below mean income of $57,582 for full-time workers. If the 159 million adult citizens with no reported earnings (94 million that can work but choose not to, and the 65 million who cannot work) were included, an astounding 86% (278 million) were below average. This imbalance is much larger than most people perceive and is a major contributor to the social unrest being exhibited today and a major issue for the Trump Administration.
The issue of income inequality is especially acute to (1) the growing cadre of contingent workers (discussed in detail in earlier series blogs, “President Trump’s Gig Workforce” and “President Trump’s Non-Standard Workforce”) who make significantly less wages than standard workers, (2) disparities related to race, ethnicity and gender, which are increasingly part of the American political dialogue and public discourse, and (3) for the discouraged American adults who voluntarily departed the labor force for alternative lifestyles and livelihoods of public and familial dependency (discussed in an earlier blog entitled “Why Work Anymore?”).
Low wages and income fuel discord and unrest. The high level of social and political unrest was evident in the recent Presidential elections as a polarized electorate swung heavily to perceived anti-establishment candidates like Bernie Sanders and Donald Trump. It is also clearly evident in the African-American community as evidenced by recent rioting and violence. Jobenomics is actively engaged with dozens of financially distressed African-American communities and is familiar with their frustrations and anger. However, Jobenomics is quick to point out to community leaders that anger is not unique to Black males in financially distressed communities.
Based on Census Bureau data, 12,687,000 Black males earn below average wages or no wages at all. In comparison, there are 72,417,000 (6-times) as many White males who earn below average wages or no wages. Surprisingly, in relation to their racial group, the percentage is approximately equal. According to the Census Bureau, the total American Black male population was 19,971,000 and the total White male population was 122,062,000. Thus, the percentage of below average wage earners in the Black community was 63.5% versus 59.3% for White, which is close to being statistically equal. For the most part, White males are equally frustrated and angered due to the current economic environment and the climate of political correctness, which they perceive as anti-White. 17,799,000 American Hispanic males and 4,718,000 American Asian males that make below average income are also discouraged.
If any single demographic has a reason to be frustrated or angry, it should be females who suffer disproportionally greater economic deprecation than males across all racial and ethnic groups. As highlighted in red on the chart, the U.S. Female-to-Male earnings ratio is 0.80, which means that American females make 80% of the earnings of their male counterparts. The Female-to-Male earnings ratio for a Female Family Householder (no husband present) is 0.74 and for a single Female Householder 0.57. The Female-to-Male earnings ratio for minority females is even more atrocious, especially for those trapped in depressed inner-city neighborhoods.
America is a deeply divided nation politically, socially, culturally, ethnologically and economically. Many believe that the ideological divide is even wider than it was prior to the secession that led to the American Civil War. In early 2019, Californians will go to the polls in a historic vote to decide by referendum if California should exit the Union, vote either yes or no for “Calexit”. Whether or not Calexit is merely political theatrics, it certainly is troublesome. America is at a crossroads where the liberal left no longer believes anything the conservative right as to say, and vice versa. Now that the 2016 elections are history, the world is anxiously watching to see if the Trump Administration can unite the nation to address divisiveness, inadequacies and disparities.
Political activists assert the United States is one of the most inequitable distributors of income on the planet and that income inequality is always bad. Both of these assertions are not as accurate as many activists would want you to believe.
Regarding the assertion that America is inherently inequitable, the Gini Index shows that the United States is in the middle of the pack of comparable modern economies regarding worldwide income inequality. A Gini Index a measurement of income distribution that ranges from 0, representing perfect equality, to 100, representing perfect inequality.
Worldwide Income Inequality
CIA World Factbook Distribution of Family Income-Gini Index
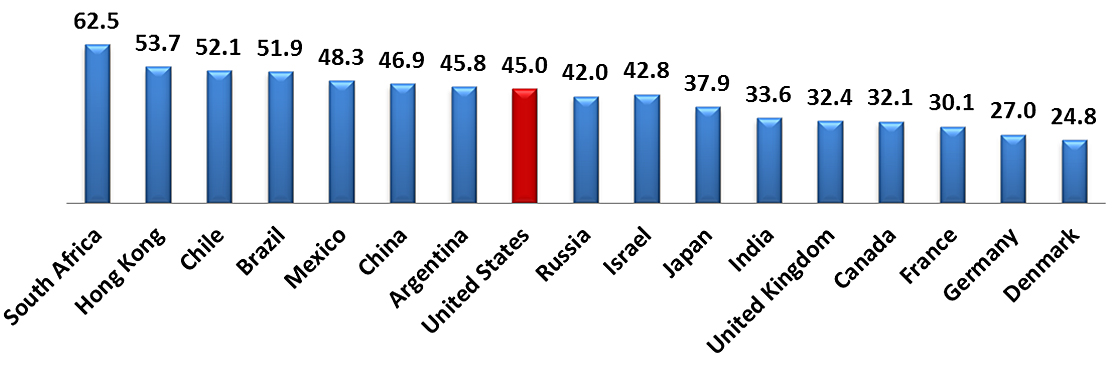
A number of international organizations, like the World Bank and International Monetary Fund, use the Gini Ratio to define income inequality among nations. The Global Income Inequality chart (above) was created by Jobenomics using U.S. Central Intelligence Agency data listed in their widely-accessed World Factbook Distribution of Family Income-Gini Index. The world’s worst income inequality is in emerging and totalitarian countries. Industrial and democratic countries are much more equitable in terms of income. Globalization has narrowed the income inequality between nations, but has exacerbated income inequality within nations, due to global competition, international supply chains, global capital markets, and new information technology.
Income inequality is not a condition that we should tolerate, but is whimsical to believe that austerity is always bad. Some degree of income inequality can be tolerated as long as a corresponding degree of income opportunity exists. Individuals and businesses would not innovate without the opportunity to reap rewards. When opportunity exceeds inequality, people are generally optimistic and motivated to succeed. However, when inequality exceeds opportunity, people are unhappy and motivated towards discordance. Unfortunately, America has entered a period where inequality exceeds opportunity, which places our nation and economy at risk.
Throughout history, income inequality has been a powerful motivator. The American Revolution had issues of income inequality at its roots. Today, many of the greatest American success stories are about people from humble beginnings. From a Jobenomics perspective, income inequality is one of the primary motivators for entrepreneurs to innovate, get a job and start a business regardless of any obstacles related to education, race, ethnicity, gender, age or nativity.
Rate and Composition of New U.S. Entrepreneurs
Source: Kauffman Startup Index: National
According to the Kaufmann Foundation, a leading U.S. foundation focused on education and entrepreneurship, “business startups account for about 20% of US gross (total) job creation while high-growth (startup) businesses account for almost 50% of gross job creation.” As shown, education, race, ethnicity, gender, age or nativity are not disincentives if income opportunity abounds.
Stay tuned for the next installment in the President Trump’s New Economy Challenge series entitled, “President Trump’s Income Opportunity Solution” scheduled for release on 26 March 2017.
Click to read the rest of this articles in a 20-part series on President Trump’s New Economy Challenge. Note: many series articles require a small ($5) subscription fee. Non-series articles and Jobenomics project reports are free at Jobenomics.com. All subscription fees are directly (100%) applied to the Jobenomics Urban Renewal Programs. Donations to revitalizing blighted inner-cities are most welcome.
About Jobenomics: Jobenomics deals with economics of business and job creation. The non-partisan Jobenomics National Grassroots Movement’s goal is to facilitate an environment that will create 20 million net new middle-class U.S. jobs within a decade. The Movement has a following of an estimated 20 million people. The Jobenomics website contains numerous books and material on how to mass-produce small business and jobs. Monthly website traffic exceeds one-half million hits, which is indicative of the high level of public interest regarding economic, business, labor force and workfare solutions. For more information, see Jobenomics Overview and the Author’s Biography.

